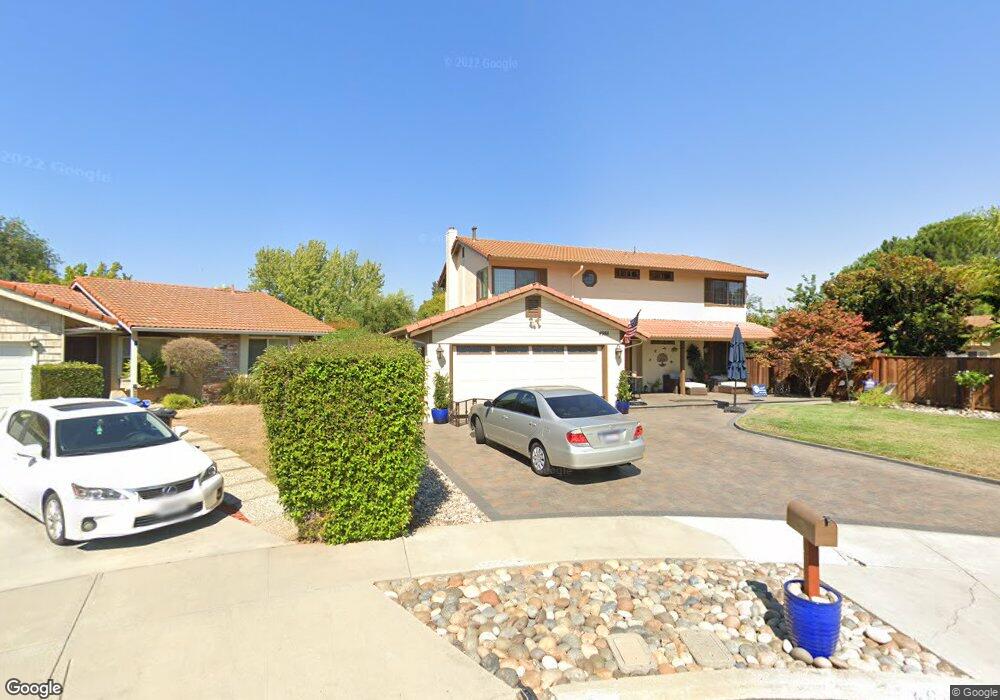
4986 Avery Ct San Jose, CA 95136
Parkview NeighborhoodEstimated Value: $1,592,000 - $1,839,000
5
Beds
3
Baths
1,954
Sq Ft
$897/Sq Ft
Est. Value
About This Home
This home is located at 4986 Avery Ct, San Jose, CA 95136 and is currently estimated at $1,752,790, approximately $897 per square foot. 4986 Avery Ct is a home located in Santa Clara County with nearby schools including Rachel Carson Elementary School, John Muir Middle School, and Gunderson High School.
Ownership History
Date
Name
Owned For
Owner Type
Purchase Details
Closed on
Apr 23, 2019
Sold by
Hall Robert L and Hall Trisha
Bought by
Hall Robert Lewis and Hall Trisha Donnell
Current Estimated Value
Purchase Details
Closed on
Jun 25, 2002
Sold by
Brodeur Donald B and Brodeur Katherine M
Bought by
Hall Robert L and Hall Trisha
Home Financials for this Owner
Home Financials are based on the most recent Mortgage that was taken out on this home.
Original Mortgage
$484,000
Outstanding Balance
$192,884
Interest Rate
6%
Estimated Equity
$1,559,906
Purchase Details
Closed on
Jun 6, 1996
Sold by
Leyden Robert R
Bought by
Brodeur Donald B and Brodeur Katherine M
Home Financials for this Owner
Home Financials are based on the most recent Mortgage that was taken out on this home.
Original Mortgage
$261,250
Interest Rate
8.01%
Create a Home Valuation Report for This Property
The Home Valuation Report is an in-depth analysis detailing your home's value as well as a comparison with similar homes in the area
Home Values in the Area
Average Home Value in this Area
Purchase History
| Date | Buyer | Sale Price | Title Company |
|---|---|---|---|
| Hall Robert Lewis | -- | None Available | |
| Hall Robert L | $605,000 | Stewart Title | |
| Brodeur Donald B | $275,000 | Fidelity National Title Co |
Source: Public Records
Mortgage History
| Date | Status | Borrower | Loan Amount |
|---|---|---|---|
| Open | Hall Robert L | $484,000 | |
| Previous Owner | Brodeur Donald B | $261,250 | |
| Closed | Hall Robert L | $60,500 |
Source: Public Records
Tax History Compared to Growth
Tax History
| Year | Tax Paid | Tax Assessment Tax Assessment Total Assessment is a certain percentage of the fair market value that is determined by local assessors to be the total taxable value of land and additions on the property. | Land | Improvement |
|---|---|---|---|---|
| 2025 | $11,445 | $876,221 | $481,852 | $394,369 |
| 2024 | $11,445 | $859,041 | $472,404 | $386,637 |
| 2023 | $11,223 | $842,198 | $463,142 | $379,056 |
| 2022 | $11,127 | $825,685 | $454,061 | $371,624 |
| 2021 | $10,894 | $809,496 | $445,158 | $364,338 |
| 2020 | $10,643 | $801,197 | $440,594 | $360,603 |
| 2019 | $10,333 | $785,488 | $431,955 | $353,533 |
| 2018 | $10,227 | $770,087 | $423,486 | $346,601 |
| 2017 | $10,142 | $754,988 | $415,183 | $339,805 |
| 2016 | $9,958 | $740,186 | $407,043 | $333,143 |
| 2015 | $9,890 | $729,068 | $400,929 | $328,139 |
| 2014 | $9,434 | $714,788 | $393,076 | $321,712 |
Source: Public Records
Map
Nearby Homes
- 4999 Massachusetts Dr
- 5031 Massachusetts Dr
- 4908 New Ramsey Ct
- 4614 Black River Ct
- 4645 Columbia River Ct
- 4636 Columbia River Ct
- 472 Meadow Dale Ct
- 4537 Windsor Park Dr
- 4604 Royal Forest Ct
- 775 Amanda Dr
- 4284 Meg Dr
- 883 Calle de Verde
- 574 Churchill Park Dr
- 5012 Moonstone Ct
- 398 Bluefield Dr
- 643 Yolo Ct
- 3940 Luneta Ct
- 864 Midvale Ln
- 5368 Colony Park Cir Unit 258
- 589 Cadburry Ct