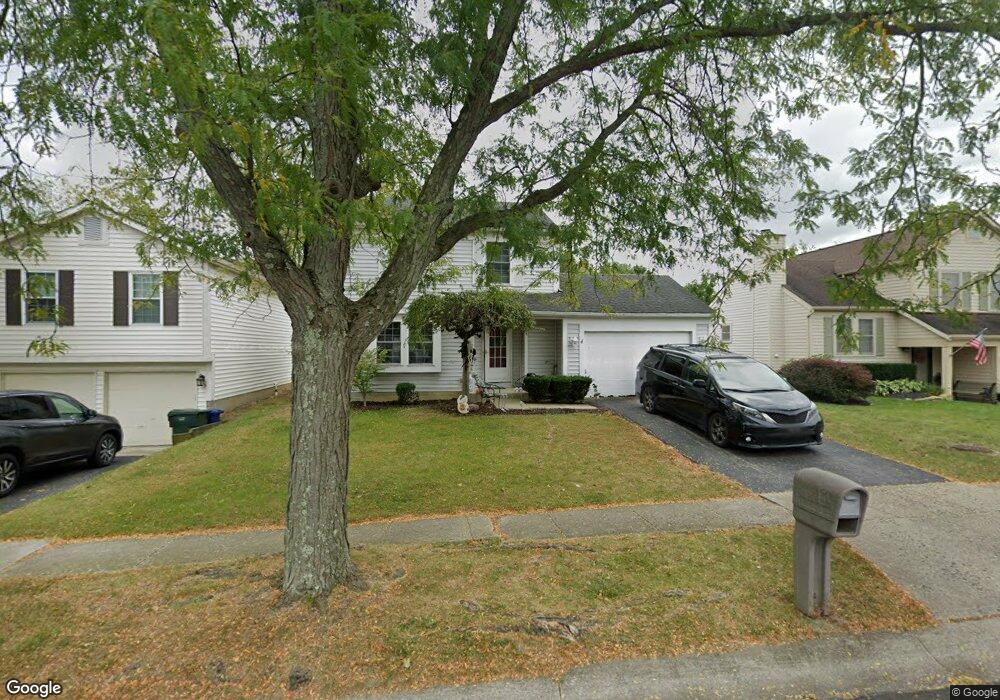
4991 Hidden View Ct Hilliard, OH 43026
Cross Creek NeighborhoodEstimated Value: $337,177 - $374,000
3
Beds
2
Baths
1,206
Sq Ft
$292/Sq Ft
Est. Value
About This Home
This home is located at 4991 Hidden View Ct, Hilliard, OH 43026 and is currently estimated at $352,294, approximately $292 per square foot. 4991 Hidden View Ct is a home located in Franklin County with nearby schools including J W Reason Elementary School, Hilliard Station Sixth Grade Elementary School, and Hilliard Heritage Middle School.
Ownership History
Date
Name
Owned For
Owner Type
Purchase Details
Closed on
Sep 19, 2017
Sold by
Kryszan David J
Bought by
Winters Kryszan David J and Winters Kryszan Molly
Current Estimated Value
Home Financials for this Owner
Home Financials are based on the most recent Mortgage that was taken out on this home.
Original Mortgage
$136,000
Outstanding Balance
$113,539
Interest Rate
3.89%
Mortgage Type
New Conventional
Estimated Equity
$238,755
Purchase Details
Closed on
Sep 6, 2011
Sold by
Ashkar Julie
Bought by
Kryszan David J
Home Financials for this Owner
Home Financials are based on the most recent Mortgage that was taken out on this home.
Original Mortgage
$138,608
Interest Rate
4.5%
Mortgage Type
FHA
Purchase Details
Closed on
Jun 16, 2008
Sold by
Keaton Toby L
Bought by
Ashkar Julie and Ashkar David J
Home Financials for this Owner
Home Financials are based on the most recent Mortgage that was taken out on this home.
Original Mortgage
$137,750
Interest Rate
6.37%
Mortgage Type
Purchase Money Mortgage
Purchase Details
Closed on
May 28, 1999
Sold by
Finnegan Kelly L
Bought by
Keaton Toby L
Purchase Details
Closed on
Apr 3, 1989
Bought by
Finnegan Kelly L
Create a Home Valuation Report for This Property
The Home Valuation Report is an in-depth analysis detailing your home's value as well as a comparison with similar homes in the area
Home Values in the Area
Average Home Value in this Area
Purchase History
| Date | Buyer | Sale Price | Title Company |
|---|---|---|---|
| Winters Kryszan David J | -- | Monarch Title Svcs Llc | |
| Kryszan David J | -- | Attorney | |
| Ashkar Julie | $145,000 | Chicago Tit | |
| Keaton Toby L | $109,900 | Chicago Title | |
| Finnegan Kelly L | $78,800 | -- |
Source: Public Records
Mortgage History
| Date | Status | Borrower | Loan Amount |
|---|---|---|---|
| Open | Winters Kryszan David J | $136,000 | |
| Closed | Kryszan David J | $138,608 | |
| Previous Owner | Ashkar Julie | $137,750 |
Source: Public Records
Tax History Compared to Growth
Tax History
| Year | Tax Paid | Tax Assessment Tax Assessment Total Assessment is a certain percentage of the fair market value that is determined by local assessors to be the total taxable value of land and additions on the property. | Land | Improvement |
|---|---|---|---|---|
| 2024 | $5,191 | $91,910 | $28,700 | $63,210 |
| 2023 | $4,497 | $91,910 | $28,700 | $63,210 |
| 2022 | $3,375 | $55,230 | $11,830 | $43,400 |
| 2021 | $3,371 | $55,230 | $11,830 | $43,400 |
| 2020 | $3,362 | $55,230 | $11,830 | $43,400 |
| 2019 | $3,034 | $42,560 | $9,450 | $33,110 |
| 2018 | $3,228 | $42,560 | $9,450 | $33,110 |
| 2017 | $3,343 | $42,560 | $9,450 | $33,110 |
| 2016 | $3,664 | $47,810 | $10,990 | $36,820 |
| 2015 | $3,434 | $47,810 | $10,990 | $36,820 |
| 2014 | $3,441 | $47,810 | $10,990 | $36,820 |
| 2013 | $1,724 | $47,285 | $10,465 | $36,820 |
Source: Public Records
Map
Nearby Homes
- 4976 Shady Oak Dr
- 5052 Bressler Dr
- 2756 Shelton Cir
- 4995 Singleton Dr
- 4995 Singleton Dr Unit 18c
- 2759 Lyndley Ct
- 5112 Bressler Dr
- 4945 Singleton Dr Unit 13C
- 5188 Calhoon Ct
- 5215 Bressler Dr
- 2477 Crystal Springs Dr
- 5258 Skytrail Dr
- 2967 Castlebrook Ave
- 2401 Featherwood Dr
- 3012 Papin St Unit 39
- 4969 Hilliard Green Dr
- 2378 Myrtle Valley Dr
- 5285 Redlands Dr
- 2321 Shelby Ln
- 3111 Castlebrook Ave
- 4983 Hidden View Ct
- 4999 Hidden View Ct
- 4975 Hidden View Ct
- 5011 Hidden View Dr
- 2676 Ashlynn Ln
- 5019 Hidden View Dr
- 5000 Amblyn Ct
- 4963 Hidden View Ct
- 4972 Hidden View Ct
- 2682 Ashlynn Ln
- 5000 Hidden View Dr
- 5006 Amblyn Ct
- 4966 Hidden View Ct
- 5025 Hidden View Dr
- 4957 Hidden View Ct
- 2690 Ashlynn Ln
- 4988 Hilliard Oaks Ct
- 5010 Hidden View Dr
- 4960 Hidden View Ct
- 4993 Amblyn Ct