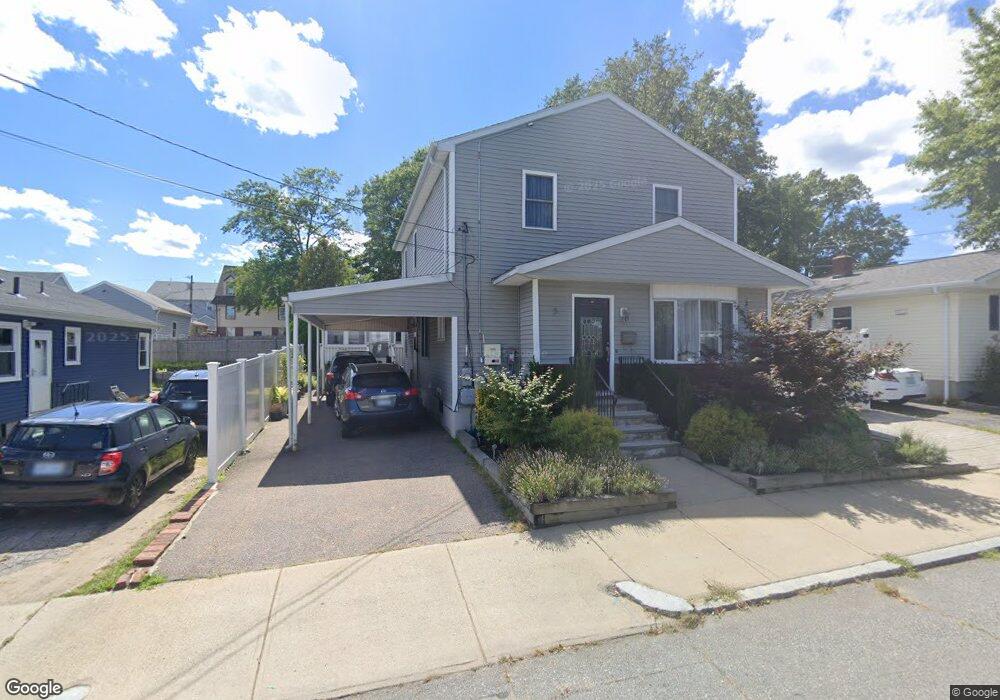
5 Batcheller Ave Providence, RI 02904
Charles NeighborhoodEstimated Value: $449,400 - $535,000
4
Beds
2
Baths
2,052
Sq Ft
$241/Sq Ft
Est. Value
About This Home
This home is located at 5 Batcheller Ave, Providence, RI 02904 and is currently estimated at $494,600, approximately $241 per square foot. 5 Batcheller Ave is a home located in Providence County with nearby schools including Times Squared Academy, Times2 Elementary School, and The San Miguel School.
Ownership History
Date
Name
Owned For
Owner Type
Purchase Details
Closed on
Nov 17, 2021
Sold by
Antunes Celso and Gomes Egidia
Bought by
Antunes Celso P and Antunes Odelisa P
Current Estimated Value
Purchase Details
Closed on
Feb 12, 2014
Sold by
Gomes Egidia
Bought by
Antunes Celso and Gomes Egidia
Purchase Details
Closed on
Aug 10, 2012
Sold by
Antunes Celso
Bought by
Gomes Egidia
Purchase Details
Closed on
Jun 8, 1993
Sold by
Desmarais Paul D and Desmarais Maria
Bought by
Gomes Egidia
Create a Home Valuation Report for This Property
The Home Valuation Report is an in-depth analysis detailing your home's value as well as a comparison with similar homes in the area
Home Values in the Area
Average Home Value in this Area
Purchase History
| Date | Buyer | Sale Price | Title Company |
|---|---|---|---|
| Antunes Celso P | -- | None Available | |
| Antunes Celso | -- | -- | |
| Gomes Egidia | -- | -- | |
| Gomes Egidia | $110,000 | -- |
Source: Public Records
Mortgage History
| Date | Status | Borrower | Loan Amount |
|---|---|---|---|
| Previous Owner | Gomes Egidia | $100,000 | |
| Previous Owner | Gomes Egidia | $58,000 |
Source: Public Records
Tax History
| Year | Tax Paid | Tax Assessment Tax Assessment Total Assessment is a certain percentage of the fair market value that is determined by local assessors to be the total taxable value of land and additions on the property. | Land | Improvement |
|---|---|---|---|---|
| 2025 | $3,593 | $427,700 | $128,000 | $299,700 |
| 2024 | $7,019 | $382,500 | $84,000 | $298,500 |
| 2023 | $7,019 | $382,500 | $84,000 | $298,500 |
| 2022 | $6,809 | $382,500 | $84,000 | $298,500 |
| 2021 | $6,263 | $255,000 | $61,000 | $194,000 |
| 2020 | $6,263 | $255,000 | $61,000 | $194,000 |
| 2019 | $6,263 | $255,000 | $61,000 | $194,000 |
| 2018 | $5,734 | $179,400 | $47,100 | $132,300 |
| 2017 | $5,734 | $179,400 | $47,100 | $132,300 |
| 2016 | $5,734 | $179,400 | $47,100 | $132,300 |
| 2015 | $5,826 | $176,000 | $47,700 | $128,300 |
| 2014 | $5,940 | $176,000 | $47,700 | $128,300 |
| 2013 | $5,940 | $176,000 | $47,700 | $128,300 |
Source: Public Records
Map
Nearby Homes
Your Personal Tour Guide
Ask me questions while you tour the home.