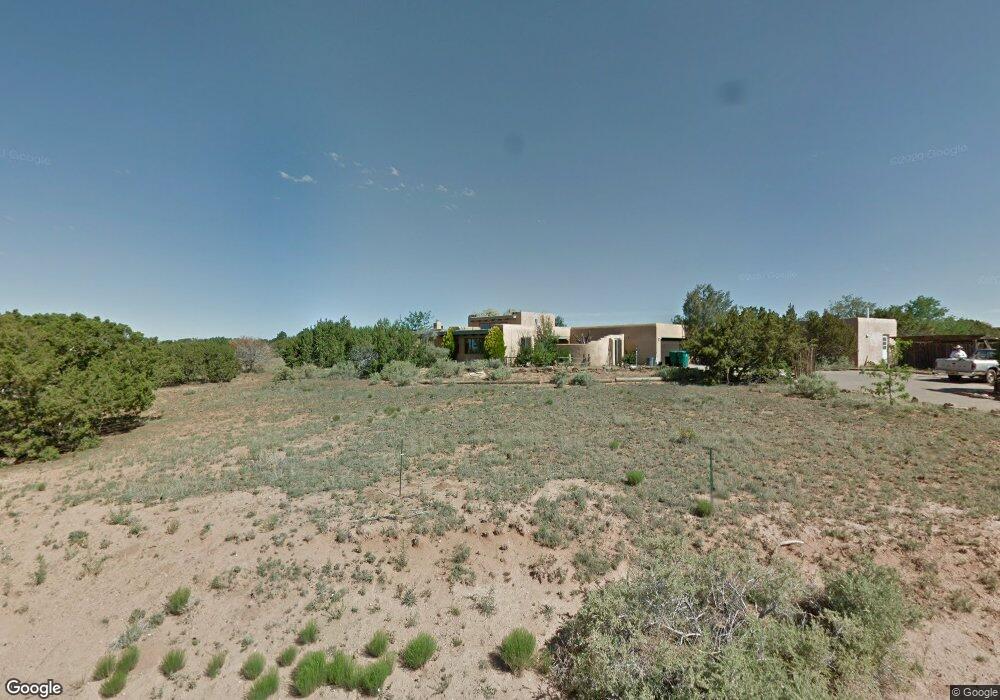
5 Casa Del Oro Loop Santa Fe, NM 87508
Eldorado at Santa Fe NeighborhoodEstimated Value: $727,000 - $996,000
4
Beds
2
Baths
3,100
Sq Ft
$270/Sq Ft
Est. Value
About This Home
This home is located at 5 Casa Del Oro Loop, Santa Fe, NM 87508 and is currently estimated at $837,191, approximately $270 per square foot. 5 Casa Del Oro Loop is a home located in Santa Fe County with nearby schools including El Dorado Community School and Santa Fe High School.
Ownership History
Date
Name
Owned For
Owner Type
Purchase Details
Closed on
Jul 15, 2025
Sold by
Boggess Carolyn Fonyo
Bought by
Hall Brennan J and Hall Helena
Current Estimated Value
Home Financials for this Owner
Home Financials are based on the most recent Mortgage that was taken out on this home.
Original Mortgage
$576,000
Outstanding Balance
$575,025
Interest Rate
6.85%
Mortgage Type
New Conventional
Estimated Equity
$262,166
Purchase Details
Closed on
Dec 4, 2020
Sold by
Koch Patricia R and Jw & Cc Llc
Bought by
Boggers Carolyn Fonyo
Home Financials for this Owner
Home Financials are based on the most recent Mortgage that was taken out on this home.
Original Mortgage
$404,800
Interest Rate
2.8%
Mortgage Type
New Conventional
Purchase Details
Closed on
Jan 19, 2007
Sold by
Koch Patricia R and Koch Patricia
Bought by
Jw&Cc Llc
Purchase Details
Closed on
Jan 12, 2007
Sold by
Koch Manfred J
Bought by
Koch Patricia R and Koch Patricia
Purchase Details
Closed on
Jun 9, 2000
Sold by
Congdon Gregg C
Bought by
Koch Manfredf J and Koch Patricia R
Create a Home Valuation Report for This Property
The Home Valuation Report is an in-depth analysis detailing your home's value as well as a comparison with similar homes in the area
Home Values in the Area
Average Home Value in this Area
Purchase History
| Date | Buyer | Sale Price | Title Company |
|---|---|---|---|
| Hall Brennan J | -- | First American Title Insurance | |
| Boggers Carolyn Fonyo | -- | First American Title Ins Co | |
| Jw&Cc Llc | -- | None Available | |
| Koch Patricia R | -- | None Available | |
| Koch Manfredf J | -- | -- |
Source: Public Records
Mortgage History
| Date | Status | Borrower | Loan Amount |
|---|---|---|---|
| Open | Hall Brennan J | $576,000 | |
| Previous Owner | Boggers Carolyn Fonyo | $404,800 |
Source: Public Records
Tax History
| Year | Tax Paid | Tax Assessment Tax Assessment Total Assessment is a certain percentage of the fair market value that is determined by local assessors to be the total taxable value of land and additions on the property. | Land | Improvement |
|---|---|---|---|---|
| 2025 | $3,873 | $558,485 | $89,139 | $469,346 |
| 2024 | $3,793 | $542,219 | $86,543 | $455,676 |
| 2023 | $3,797 | $526,427 | $84,023 | $442,404 |
| 2022 | $3,700 | $511,095 | $81,576 | $429,519 |
| 2021 | $3,629 | $165,403 | $26,399 | $139,004 |
| 2020 | $2,421 | $109,579 | $24,733 | $84,846 |
| 2019 | $2,374 | $106,388 | $24,733 | $81,655 |
| 2018 | $2,312 | $103,289 | $24,733 | $78,556 |
| 2017 | $2,233 | $100,281 | $24,733 | $75,548 |
| 2016 | $2,096 | $97,361 | $24,510 | $72,851 |
| 2015 | $2,056 | $94,525 | $24,510 | $70,015 |
| 2014 | $1,947 | $91,681 | $24,485 | $67,195 |
Source: Public Records
Map
Nearby Homes
- 4 Cerrado Loop
- 5 Cerrado Ct
- 16 Antigua Rd
- 32 Lucero Rd Unit A-B
- 42 Estambre Rd
- 9 Antigua Rd
- 10 Cerrado Rd
- 85 Herrada Rd
- 1 Sabroso Place
- 7 Casa Del Oro Way
- 71 Camerada Loop
- 16 Jornada Place
- 38 Encantado Loop
- 62 Encantado Loop
- 2 Abanico Rd
- 275 Avenue Eldorado
- 5 Dovela Place
- 59 Mejor Lado
- 39 Monterey Rd
- 3 Gavilan Ct
- 3 Casa Del Oro Loop
- 146 Avenida Casa Del Oso
- 16 Casa Del Oro Loop
- 18 Casa Del Oro Loop
- 1 Casa Del Oro Loop
- 10 Casa Del Oro Loop
- 20 Casa Del Oro Loop
- 14 Casa Del Oro Loop
- 12 Casa Del Oro Loop
- 8 Casa Del Oro Loop
- 7 Casa Del Oro Ln
- 6 Casa Del Oro Loop
- 4 Casa Del Oro Loop
- 2 Casa Del Oro Loop
- 5 Casa Del Oro Ln
- 6 Casa Del Oro Ln
- 6 Casa Del Oro Place
- 3 Casa Del Oro Ln
- 9 Casa Del Oro Ct
- 2 Casa Del Oro Ln
Your Personal Tour Guide
Ask me questions while you tour the home.