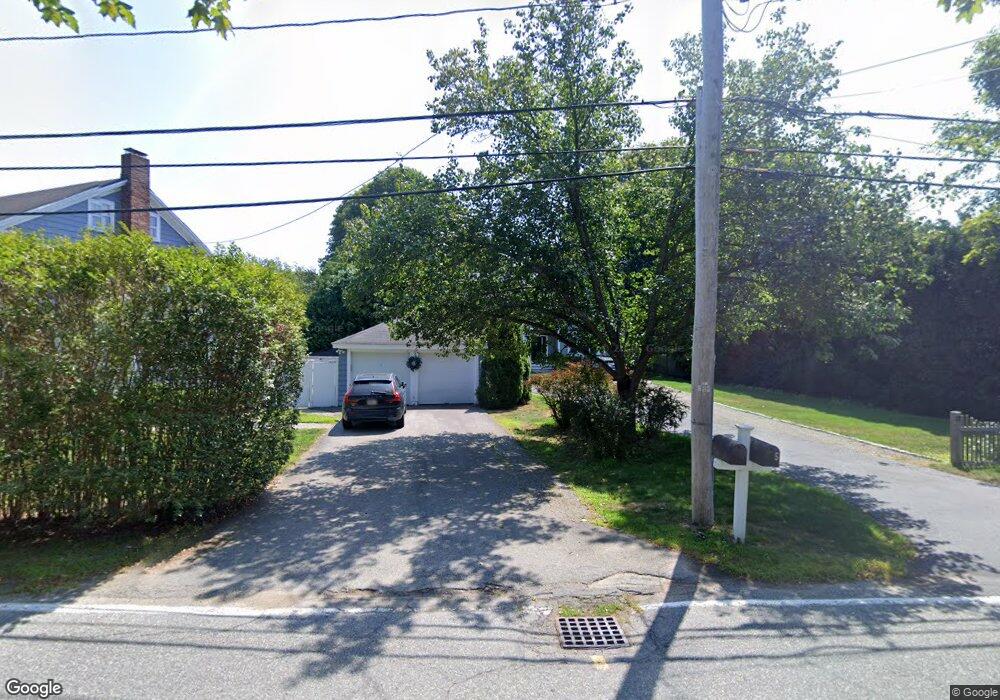
5 Cedar St Wenham, MA 01984
Estimated Value: $1,079,030 - $1,534,000
3
Beds
3
Baths
2,779
Sq Ft
$481/Sq Ft
Est. Value
About This Home
This home is located at 5 Cedar St, Wenham, MA 01984 and is currently estimated at $1,337,258, approximately $481 per square foot. 5 Cedar St is a home located in Essex County with nearby schools including Winthrop School, Bessie Buker Elementary School, and Cutler Elementary School.
Ownership History
Date
Name
Owned For
Owner Type
Purchase Details
Closed on
May 23, 2014
Sold by
Stravato Richard
Bought by
Montoya Francisco and Montoya Karin U
Current Estimated Value
Home Financials for this Owner
Home Financials are based on the most recent Mortgage that was taken out on this home.
Original Mortgage
$175,000
Outstanding Balance
$131,022
Interest Rate
4.33%
Mortgage Type
New Conventional
Estimated Equity
$1,206,236
Purchase Details
Closed on
Aug 30, 2002
Sold by
T Ford Co and Ford
Bought by
Stravato Richard and Stravato Meredith G
Purchase Details
Closed on
Sep 12, 2001
Sold by
Fina Bruce
Bought by
Ford Thomas and T Ford Co
Purchase Details
Closed on
Sep 11, 2000
Sold by
Brooks Lloyd C Est and Stone
Bought by
Fina Bruce
Create a Home Valuation Report for This Property
The Home Valuation Report is an in-depth analysis detailing your home's value as well as a comparison with similar homes in the area
Home Values in the Area
Average Home Value in this Area
Purchase History
We collect this data history from publicly available records. To have your information removed, we recommend requesting removal directly through your county’s website.
| Date | Buyer | Sale Price | Title Company |
|---|---|---|---|
| Montoya Francisco | $632,000 | -- | |
| Montoya Francisco | $632,000 | -- | |
| Stravato Richard | $669,900 | -- | |
| Stravato Richard R | $669,900 | -- | |
| Ford Thomas | $195,000 | -- | |
| Ford Thomas | $195,000 | -- | |
| Fina Bruce | $110,000 | -- | |
| Fina Bruce P | $110,000 | -- |
Source: Public Records
Mortgage History
We collect this data history from publicly available records. To have your information removed, we recommend requesting removal directly through your county’s website.
| Date | Status | Borrower | Loan Amount |
|---|---|---|---|
| Open | Montoya Francisco | $175,000 | |
| Closed | Fina Bruce P | $175,000 |
Source: Public Records
Tax History
| Year | Tax Paid | Tax Assessment Tax Assessment Total Assessment is a certain percentage of the fair market value that is determined by local assessors to be the total taxable value of land and additions on the property. | Land | Improvement |
|---|---|---|---|---|
| 2025 | $13,242 | $852,100 | $370,000 | $482,100 |
| 2024 | $12,893 | $823,300 | $370,000 | $453,300 |
| 2023 | $12,169 | $701,400 | $361,800 | $339,600 |
| 2022 | $12,398 | $633,200 | $291,300 | $341,900 |
| 2021 | $12,050 | $612,300 | $270,400 | $341,900 |
| 2020 | $11,159 | $589,200 | $270,500 | $318,700 |
| 2019 | $10,617 | $589,200 | $270,500 | $318,700 |
| 2018 | $10,872 | $578,600 | $261,800 | $316,800 |
| 2017 | $10,606 | $578,600 | $261,800 | $316,800 |
| 2016 | $9,825 | $578,600 | $261,800 | $316,800 |
| 2015 | $8,509 | $523,600 | $261,800 | $261,800 |
Source: Public Records
Map
Nearby Homes
Your Personal Tour Guide
Ask me questions while you tour the home.