Estimated Value: $2,599,000 - $2,746,054
4
Beds
5
Baths
3,301
Sq Ft
$810/Sq Ft
Est. Value
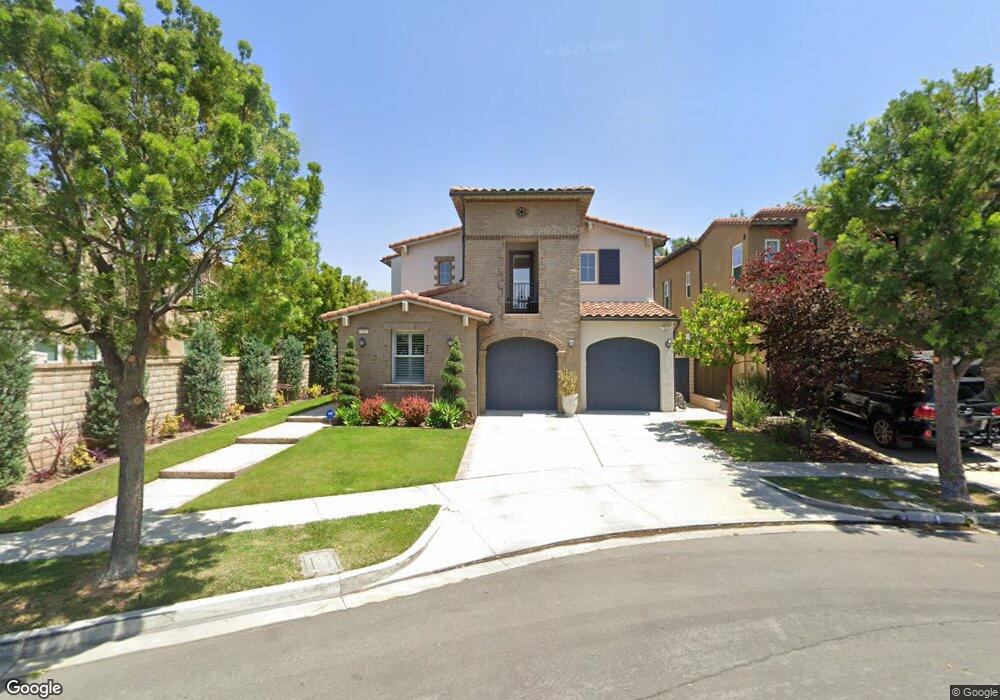
About This Home
This home is located at 5 Conifer, Irvine, CA 92620 and is currently estimated at $2,673,264, approximately $809 per square foot. 5 Conifer is a home located in Orange County with nearby schools including Jeffrey Trail Middle, Portola High School, and New Horizon Elementary School.
Ownership History
Date
Name
Owned For
Owner Type
Purchase Details
Closed on
Sep 22, 2021
Sold by
Ajouz Mazen and Attar Ragad
Bought by
Attar Ragad and Ajouz Mazen Mustapha
Current Estimated Value
Purchase Details
Closed on
Oct 7, 2011
Sold by
Lani Manijeh E
Bought by
Ajouz Mazen and Attar Ragad
Home Financials for this Owner
Home Financials are based on the most recent Mortgage that was taken out on this home.
Original Mortgage
$763,000
Outstanding Balance
$508,898
Interest Rate
3.95%
Mortgage Type
New Conventional
Estimated Equity
$2,164,366
Purchase Details
Closed on
Apr 22, 2009
Sold by
Lennar Homes Of California Inc
Bought by
Lani Manijeh E and The Manijeh E Lani Trust
Create a Home Valuation Report for This Property
The Home Valuation Report is an in-depth analysis detailing your home's value as well as a comparison with similar homes in the area
Home Values in the Area
Average Home Value in this Area
Purchase History
| Date | Buyer | Sale Price | Title Company |
|---|---|---|---|
| Attar Ragad | -- | None Available | |
| Ajouz Mazen | $1,030,000 | Equity Title Orange County-I | |
| Lani Manijeh E | $1,109,000 | None Available |
Source: Public Records
Mortgage History
| Date | Status | Borrower | Loan Amount |
|---|---|---|---|
| Open | Ajouz Mazen | $763,000 |
Source: Public Records
Tax History
| Year | Tax Paid | Tax Assessment Tax Assessment Total Assessment is a certain percentage of the fair market value that is determined by local assessors to be the total taxable value of land and additions on the property. | Land | Improvement |
|---|---|---|---|---|
| 2025 | $16,804 | $1,293,733 | $740,224 | $553,509 |
| 2024 | $16,804 | $1,268,366 | $725,710 | $542,656 |
| 2023 | $17,085 | $1,243,497 | $711,481 | $532,016 |
| 2022 | $16,732 | $1,219,115 | $697,530 | $521,585 |
| 2021 | $16,444 | $1,195,211 | $683,853 | $511,358 |
| 2020 | $16,279 | $1,182,956 | $676,841 | $506,115 |
| 2019 | $16,760 | $1,159,761 | $663,569 | $496,192 |
| 2018 | $16,493 | $1,137,021 | $650,558 | $486,463 |
| 2017 | $16,233 | $1,114,727 | $637,802 | $476,925 |
| 2016 | $16,212 | $1,092,870 | $625,296 | $467,574 |
| 2015 | $16,004 | $1,076,455 | $615,904 | $460,551 |
| 2014 | $15,767 | $1,055,369 | $603,839 | $451,530 |
Source: Public Records
Map
Nearby Homes
Your Personal Tour Guide
Ask me questions while you tour the home.