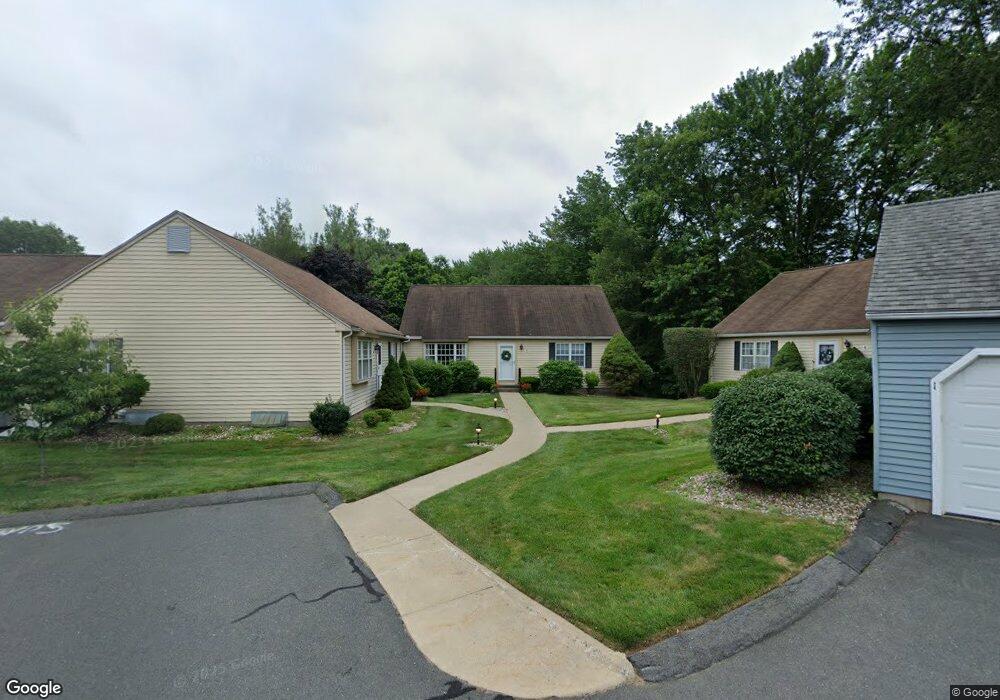
5 Curry Cross Ct Suffield, CT 06078
Estimated Value: $346,207 - $361,000
2
Beds
3
Baths
1,450
Sq Ft
$244/Sq Ft
Est. Value
About This Home
This home is located at 5 Curry Cross Ct, Suffield, CT 06078 and is currently estimated at $354,052, approximately $244 per square foot. 5 Curry Cross Ct is a home located in Hartford County with nearby schools including A. Ward Spaulding School, Mcalister Intermediate School, and Suffield Middle School.
Ownership History
Date
Name
Owned For
Owner Type
Purchase Details
Closed on
Jun 29, 2023
Sold by
Margo D Vacon Lt and Vacon
Bought by
Shipp Jane C
Current Estimated Value
Purchase Details
Closed on
Dec 9, 2020
Sold by
Vachon Margo D
Bought by
Margo D Vachon Lt and Vachon
Purchase Details
Closed on
Mar 15, 2010
Sold by
Parkview Glen Homeow A
Bought by
Vachen Margo
Home Financials for this Owner
Home Financials are based on the most recent Mortgage that was taken out on this home.
Original Mortgage
$158,000
Interest Rate
5.02%
Mortgage Type
Purchase Money Mortgage
Purchase Details
Closed on
Mar 12, 2001
Sold by
Rider Stuart and Rider Mary
Bought by
Mcdonough Edward
Home Financials for this Owner
Home Financials are based on the most recent Mortgage that was taken out on this home.
Original Mortgage
$136,000
Interest Rate
6.68%
Mortgage Type
Purchase Money Mortgage
Create a Home Valuation Report for This Property
The Home Valuation Report is an in-depth analysis detailing your home's value as well as a comparison with similar homes in the area
Home Values in the Area
Average Home Value in this Area
Purchase History
| Date | Buyer | Sale Price | Title Company |
|---|---|---|---|
| Shipp Jane C | $320,000 | None Available | |
| Margo D Vachon Lt | -- | None Available | |
| Vachen Margo | $240,000 | -- | |
| Mcdonough Edward | $170,000 | -- |
Source: Public Records
Mortgage History
| Date | Status | Borrower | Loan Amount |
|---|---|---|---|
| Previous Owner | Mcdonough Edward | $147,100 | |
| Previous Owner | Mcdonough Edward | $156,000 | |
| Previous Owner | Mcdonough Edward | $158,000 | |
| Previous Owner | Mcdonough Edward | $136,000 |
Source: Public Records
Tax History
| Year | Tax Paid | Tax Assessment Tax Assessment Total Assessment is a certain percentage of the fair market value that is determined by local assessors to be the total taxable value of land and additions on the property. | Land | Improvement |
|---|---|---|---|---|
| 2025 | $5,023 | $214,550 | $0 | $214,550 |
| 2024 | $4,667 | $206,220 | $0 | $206,220 |
| 2023 | $4,716 | $164,850 | $0 | $164,850 |
| 2022 | $4,716 | $164,850 | $0 | $164,850 |
| 2021 | $4,721 | $164,850 | $0 | $164,850 |
| 2020 | $4,721 | $164,850 | $0 | $164,850 |
| 2019 | $4,734 | $164,850 | $0 | $164,850 |
| 2018 | $4,757 | $162,260 | $0 | $162,260 |
| 2017 | $4,688 | $162,260 | $0 | $162,260 |
| 2016 | $4,576 | $162,260 | $0 | $162,260 |
| 2015 | $4,508 | $162,260 | $0 | $162,260 |
| 2014 | $4,400 | $162,260 | $0 | $162,260 |
Source: Public Records
Map
Nearby Homes
- 15 Downing Way
- 18 Daniel Cir Unit 18
- 485 Mountain Rd
- 1 E Elaine Dr
- 0 Suffield St Unit 24093452
- 0 Suffield St Unit 24057050
- 0 Stone St S Unit 24039713
- 72 Spencer St
- 424 Bridge St
- 1054 Mountain Rd
- 278 Thompsonville Rd
- 713 Thrall Ave
- 779 Bridge St
- 813 Overhill Dr
- 120 2nd St
- 98 1st St
- 420 Halladay Ave W
- Lot 54 North St
- 687 East St S
- 660 East St S
- 5 Curry Cross Ct
- 3 Curry Cross Ct
- 1 Curry Cross Ct
- 1 Curry Cross Ct Unit 1
- 2 Curry Cross Ct
- 6 Curry Cross Ct
- 6 Curry Cross Ct Unit 6
- 19 Canborne Way
- 4 Curry Cross Ct
- 4 Maybury Rd
- 4 Maybury Rd Unit 4
- 7 Maybury Rd
- 8 Maybury Rd
- 8 Maybury Rd
- 6 Strathmore Ln Unit 6
- 6 Strathmore Ln
- 6 Strathmore Ln
- 5 Maybury Rd
- 6 Maybury Rd
- 6 Maybury Rd Unit 6
Your Personal Tour Guide
Ask me questions while you tour the home.