Estimated Value: $425,000 - $461,002
3
Beds
2
Baths
1,215
Sq Ft
$365/Sq Ft
Est. Value
About This Home
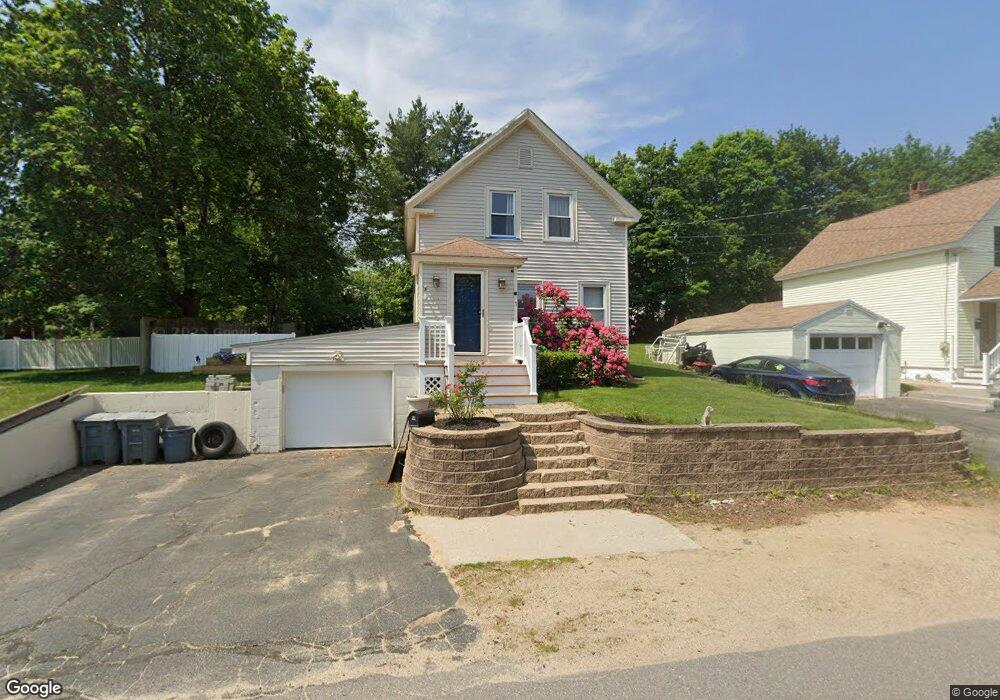
This home is located at 5 Fenway St, Derry, NH 03038 and is currently estimated at $443,501, approximately $365 per square foot. 5 Fenway St is a home located in Rockingham County with nearby schools including Grinnell School, Gilbert H. Hood Middle School, and Pinkerton Academy.
Ownership History
Date
Name
Owned For
Owner Type
Purchase Details
Closed on
Aug 6, 2004
Sold by
Grant Matthew W and Grant Jessica
Bought by
Bobek Derek J
Current Estimated Value
Home Financials for this Owner
Home Financials are based on the most recent Mortgage that was taken out on this home.
Original Mortgage
$233,239
Outstanding Balance
$117,193
Interest Rate
6.2%
Mortgage Type
Purchase Money Mortgage
Estimated Equity
$326,308
Purchase Details
Closed on
Jan 29, 2001
Sold by
Petrillo James J and Petrillo Patricia L
Bought by
Grant Matthew W and Grant Susan
Home Financials for this Owner
Home Financials are based on the most recent Mortgage that was taken out on this home.
Original Mortgage
$121,500
Interest Rate
7.39%
Purchase Details
Closed on
Apr 19, 1999
Sold by
Cordeiro Jeffrey W and Cordeiro Susan P
Bought by
Petrillo James J
Home Financials for this Owner
Home Financials are based on the most recent Mortgage that was taken out on this home.
Original Mortgage
$103,447
Interest Rate
7.04%
Create a Home Valuation Report for This Property
The Home Valuation Report is an in-depth analysis detailing your home's value as well as a comparison with similar homes in the area
Home Values in the Area
Average Home Value in this Area
Purchase History
| Date | Buyer | Sale Price | Title Company |
|---|---|---|---|
| Bobek Derek J | $236,900 | -- | |
| Grant Matthew W | $135,000 | -- | |
| Petrillo James J | $103,500 | -- |
Source: Public Records
Mortgage History
| Date | Status | Borrower | Loan Amount |
|---|---|---|---|
| Open | Petrillo James J | $233,239 | |
| Previous Owner | Petrillo James J | $121,500 | |
| Previous Owner | Petrillo James J | $103,447 |
Source: Public Records
Tax History Compared to Growth
Tax History
| Year | Tax Paid | Tax Assessment Tax Assessment Total Assessment is a certain percentage of the fair market value that is determined by local assessors to be the total taxable value of land and additions on the property. | Land | Improvement |
|---|---|---|---|---|
| 2024 | $6,768 | $362,100 | $200,400 | $161,700 |
| 2023 | $6,597 | $319,000 | $170,300 | $148,700 |
| 2022 | $6,074 | $319,000 | $170,300 | $148,700 |
| 2021 | $5,918 | $239,000 | $126,300 | $112,700 |
| 2020 | $5,817 | $239,000 | $126,300 | $112,700 |
| 2019 | $5,206 | $199,300 | $99,200 | $100,100 |
| 2018 | $5,188 | $199,300 | $99,200 | $100,100 |
| 2017 | $4,820 | $167,000 | $85,700 | $81,300 |
| 2016 | $4,519 | $167,000 | $85,700 | $81,300 |
| 2015 | $4,113 | $140,700 | $72,200 | $68,500 |
| 2014 | $4,139 | $140,700 | $72,200 | $68,500 |
| 2013 | $4,210 | $133,700 | $67,700 | $66,000 |
Source: Public Records
Map
Nearby Homes
- 84 E Broadway
- 8 Birch St
- 23 Oak St
- 32 Crystal Ave
- 8 Laurel St
- 12 Perley Rd Unit 21
- 18 Maple St Unit 1
- 24 South Ave
- 29 Central St
- 31 South Ave Unit B
- 31 South Ave Unit L
- 3 Exeter St
- 18 Elm St
- 60 N High St
- 37 Highland Ave Unit 1
- 24 Jefferson St
- 7 Dexter St
- 5 Nesmith St
- 7 Chester Rd Unit 211
- 7 Chester Rd Unit 212