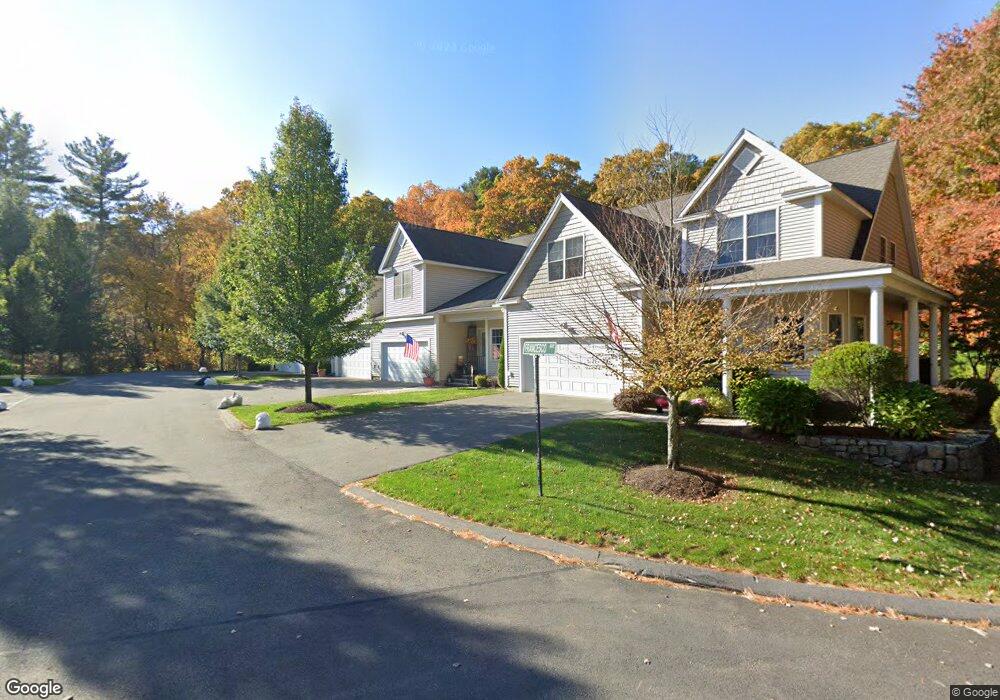
5 Francesco Ave Franklin, MA 02038
Wadsworth NeighborhoodEstimated Value: $635,000 - $677,000
2
Beds
3
Baths
2,100
Sq Ft
$311/Sq Ft
Est. Value
About This Home
This home is located at 5 Francesco Ave, Franklin, MA 02038 and is currently estimated at $654,133, approximately $311 per square foot. 5 Francesco Ave is a home located in Norfolk County with nearby schools including Jefferson Elementary School, Remington Middle School, and Franklin High School.
Ownership History
Date
Name
Owned For
Owner Type
Purchase Details
Closed on
Oct 9, 2024
Sold by
Healy Stephen J and Tyburski Lynn A
Bought by
Laplaca Elizabeth
Current Estimated Value
Purchase Details
Closed on
Apr 18, 2017
Sold by
Gagnon Ft
Bought by
Healy Stephen J and Tyburski Lynn A
Purchase Details
Closed on
Aug 1, 2008
Sold by
Miller Kent D and Miller Margaret F
Bought by
Gagnon Ft and Gagnon
Purchase Details
Closed on
Mar 17, 2005
Sold by
Oak Hill Village Lp and Oak Hill Village Llc
Bought by
Miller Kent D and Miller Margaret F
Home Financials for this Owner
Home Financials are based on the most recent Mortgage that was taken out on this home.
Original Mortgage
$304,000
Interest Rate
5.64%
Mortgage Type
Purchase Money Mortgage
Create a Home Valuation Report for This Property
The Home Valuation Report is an in-depth analysis detailing your home's value as well as a comparison with similar homes in the area
Home Values in the Area
Average Home Value in this Area
Purchase History
| Date | Buyer | Sale Price | Title Company |
|---|---|---|---|
| Laplaca Elizabeth | $650,000 | None Available | |
| Laplaca Elizabeth | $650,000 | None Available | |
| Healy Stephen J | $392,000 | -- | |
| Gagnon Ft | $384,000 | -- | |
| Gagnon Ft | $384,000 | -- | |
| Miller Kent D | $380,000 | -- | |
| Miller Kent D | $380,000 | -- |
Source: Public Records
Mortgage History
| Date | Status | Borrower | Loan Amount |
|---|---|---|---|
| Previous Owner | Miller Kent D | $304,000 |
Source: Public Records
Tax History Compared to Growth
Tax History
| Year | Tax Paid | Tax Assessment Tax Assessment Total Assessment is a certain percentage of the fair market value that is determined by local assessors to be the total taxable value of land and additions on the property. | Land | Improvement |
|---|---|---|---|---|
| 2025 | $5,960 | $512,900 | $0 | $512,900 |
| 2024 | $6,358 | $539,300 | $0 | $539,300 |
| 2023 | $5,899 | $468,900 | $0 | $468,900 |
| 2022 | $5,509 | $392,100 | $0 | $392,100 |
| 2021 | $5,624 | $383,900 | $0 | $383,900 |
| 2020 | $5,466 | $376,700 | $0 | $376,700 |
| 2019 | $5,813 | $396,500 | $0 | $396,500 |
| 2018 | $6,143 | $419,300 | $0 | $419,300 |
| 2017 | $5,711 | $391,700 | $0 | $391,700 |
| 2016 | $5,269 | $363,400 | $0 | $363,400 |
| 2015 | $5,215 | $351,400 | $0 | $351,400 |
| 2014 | $4,958 | $343,100 | $0 | $343,100 |
Source: Public Records
Map
Nearby Homes
- 2 Duhamel Way
- 2095 West St
- 851 Washington St
- 1250 Pulaski Blvd
- 8 Bubbling Brook Rd
- 65 Palmetto Dr Unit 65
- 9 Pebble Cir Unit 9
- 21 Palmetto Dr Unit 21
- 1 Spring St
- 24 Palmetto Dr Unit 24
- 352 Lake St
- 124 Lake St
- 17 Stanford Rd
- 50 Wamsutta Way
- 29 Squire Ln
- 10 Stanford Rd
- 25 Nature View Dr
- 0 Prospect St
- 20 Nature View Dr
- 236 Williams St
- 7 Francesco Ave
- 3 Francesco Ave
- 1 Francesco Ave
- 5 Francesco Ave Unit 5
- 6 Francesco Ave
- 4 Francesco Ave
- 8 Francesco Ave
- 2 Francesco Ave
- 8 Francesco Dr Unit 8
- 7 Tuscany Dr Unit 7
- 1 Tuscany Dr Unit 1
- 1 Tuscany Dr Unit 1
- 3 Tuscany Dr Unit 3
- 920 Washington St
- 33 Cassandra Ave Unit 33
- 31 Cassandra Ave Unit 31
- Lot 5 Tuscany Unit 5
- Lot 6 Tuscany Unit 6
- Lot 10 Tuscany Unit 10
- 19 Cassandra Ave Unit 29-19