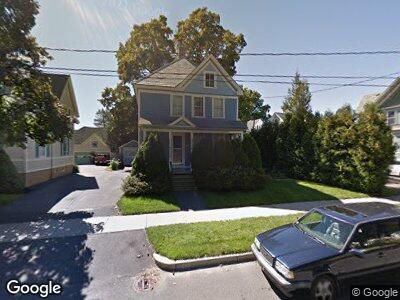
5 Hancock St Westfield, MA 01085
Estimated Value: $270,399 - $330,000
4
Beds
1
Bath
1,550
Sq Ft
$201/Sq Ft
Est. Value
About This Home
This home is located at 5 Hancock St, Westfield, MA 01085 and is currently estimated at $311,600, approximately $201 per square foot. 5 Hancock St is a home located in Hampden County with nearby schools including Westfield High School and Saint Mary High School.
Ownership History
Date
Name
Owned For
Owner Type
Purchase Details
Closed on
Aug 31, 2000
Sold by
Moyer John F
Bought by
Rackliffe Marianne and Deidolori Philip A
Current Estimated Value
Home Financials for this Owner
Home Financials are based on the most recent Mortgage that was taken out on this home.
Original Mortgage
$96,900
Outstanding Balance
$40,545
Interest Rate
8.16%
Mortgage Type
Purchase Money Mortgage
Create a Home Valuation Report for This Property
The Home Valuation Report is an in-depth analysis detailing your home's value as well as a comparison with similar homes in the area
Home Values in the Area
Average Home Value in this Area
Purchase History
| Date | Buyer | Sale Price | Title Company |
|---|---|---|---|
| Rackliffe Marianne | $102,000 | -- |
Source: Public Records
Mortgage History
| Date | Status | Borrower | Loan Amount |
|---|---|---|---|
| Open | Deidolori Marianne G | $60,000 | |
| Open | Rackliffe Marianne | $96,900 |
Source: Public Records
Tax History Compared to Growth
Tax History
| Year | Tax Paid | Tax Assessment Tax Assessment Total Assessment is a certain percentage of the fair market value that is determined by local assessors to be the total taxable value of land and additions on the property. | Land | Improvement |
|---|---|---|---|---|
| 2025 | $4,015 | $264,500 | $89,000 | $175,500 |
| 2024 | $3,860 | $241,700 | $80,900 | $160,800 |
| 2023 | $3,695 | $217,600 | $77,000 | $140,600 |
| 2022 | $3,532 | $191,000 | $68,800 | $122,200 |
| 2021 | $3,395 | $179,800 | $64,900 | $114,900 |
| 2020 | $3,284 | $170,600 | $64,900 | $105,700 |
| 2019 | $3,187 | $162,000 | $61,800 | $100,200 |
| 2018 | $3,136 | $162,000 | $61,800 | $100,200 |
| 2017 | $3,094 | $159,300 | $62,800 | $96,500 |
| 2016 | $3,097 | $159,300 | $62,800 | $96,500 |
| 2015 | $2,953 | $159,300 | $62,800 | $96,500 |
| 2014 | $2,896 | $159,300 | $62,800 | $96,500 |
Source: Public Records
Map
Nearby Homes