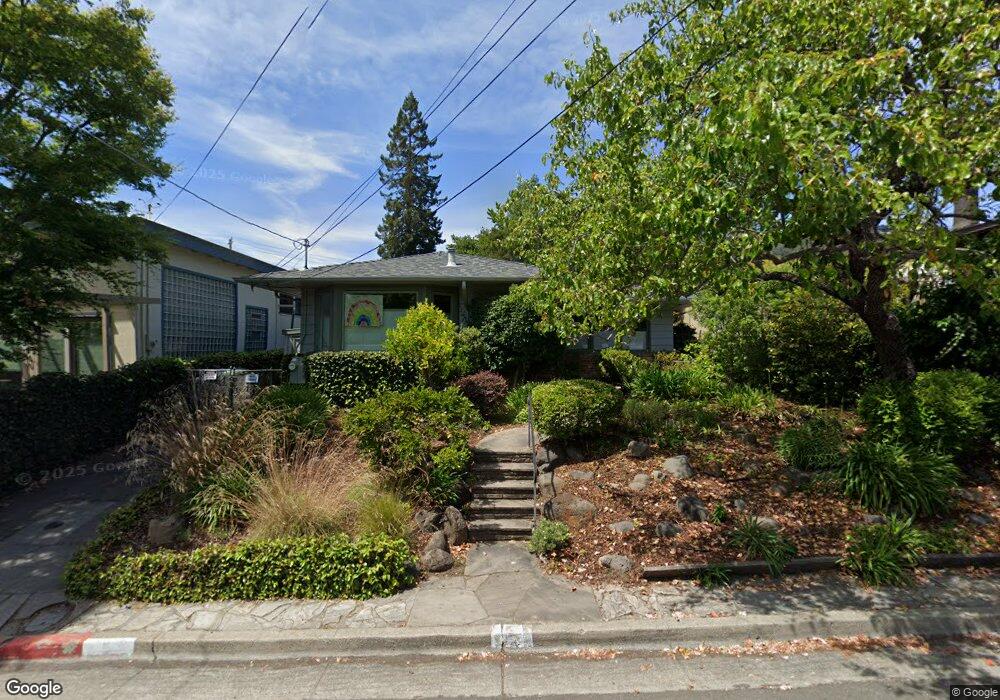
5 Hazel Rd Berkeley, CA 94705
Claremont NeighborhoodEstimated Value: $2,175,960 - $2,950,000
4
Beds
2
Baths
2,355
Sq Ft
$1,109/Sq Ft
Est. Value
About This Home
This home is located at 5 Hazel Rd, Berkeley, CA 94705 and is currently estimated at $2,612,740, approximately $1,109 per square foot. 5 Hazel Rd is a home located in Alameda County with nearby schools including John Muir Elementary School, Emerson Elementary School, and Malcolm X Elementary School.
Ownership History
Date
Name
Owned For
Owner Type
Purchase Details
Closed on
Dec 16, 2011
Sold by
Paul Jonathon David and Esptein Jamie B
Bought by
Paul Jonathon David and Epstein Jamie B
Current Estimated Value
Home Financials for this Owner
Home Financials are based on the most recent Mortgage that was taken out on this home.
Original Mortgage
$780,000
Outstanding Balance
$534,852
Interest Rate
4.06%
Mortgage Type
New Conventional
Estimated Equity
$2,077,888
Purchase Details
Closed on
Dec 1, 2011
Sold by
Morgan Janet L and The Marion L Morgan Trust One
Bought by
Paul Jonathan David and Epstein Jamie B
Home Financials for this Owner
Home Financials are based on the most recent Mortgage that was taken out on this home.
Original Mortgage
$780,000
Outstanding Balance
$534,852
Interest Rate
4.06%
Mortgage Type
New Conventional
Estimated Equity
$2,077,888
Create a Home Valuation Report for This Property
The Home Valuation Report is an in-depth analysis detailing your home's value as well as a comparison with similar homes in the area
Home Values in the Area
Average Home Value in this Area
Purchase History
| Date | Buyer | Sale Price | Title Company |
|---|---|---|---|
| Paul Jonathon David | -- | Old Republic Title Company | |
| Paul Jonathan David | $975,000 | Old Republic Title Company |
Source: Public Records
Mortgage History
| Date | Status | Borrower | Loan Amount |
|---|---|---|---|
| Open | Paul Jonathan David | $780,000 |
Source: Public Records
Tax History
| Year | Tax Paid | Tax Assessment Tax Assessment Total Assessment is a certain percentage of the fair market value that is determined by local assessors to be the total taxable value of land and additions on the property. | Land | Improvement |
|---|---|---|---|---|
| 2025 | $17,775 | $1,217,590 | $367,377 | $857,213 |
| 2024 | $17,775 | $1,193,585 | $360,175 | $840,410 |
| 2023 | $17,413 | $1,177,048 | $353,114 | $823,934 |
| 2022 | $17,120 | $1,146,970 | $346,191 | $807,779 |
| 2021 | $17,175 | $1,124,350 | $339,405 | $791,945 |
| 2020 | $16,306 | $1,119,757 | $335,927 | $783,830 |
| 2019 | $15,724 | $1,097,810 | $329,343 | $768,467 |
| 2018 | $15,473 | $1,076,291 | $322,887 | $753,404 |
| 2017 | $14,945 | $1,055,193 | $316,558 | $738,635 |
| 2016 | $14,509 | $1,034,503 | $310,351 | $724,152 |
| 2015 | $14,321 | $1,018,971 | $305,691 | $713,280 |
| 2014 | $14,186 | $999,013 | $299,704 | $699,309 |
Source: Public Records
Map
Nearby Homes
- 2962 Piedmont Ave
- 2817 Palm Ct
- 641 Alvarado Rd
- 190 Stonewall Rd
- 204 El Camino Real
- 1488 Alvarado Rd
- 0 Gravatt Dr Unit 41122154
- 2 Gravatt Dr
- 2632 Warring St Unit 3
- 260 Alvarado Rd
- 2643 Stuart St
- 0 Tunnel Rd
- 45 Vicente Rd
- 2611 Piedmont Ave Unit 4
- 142 Gravatt Dr
- 2477 Prince St
- 150 Vicente Rd
- 2601 College Ave Unit 203
- 2601 College Ave Unit 208
- 6189 Margarido Dr
Your Personal Tour Guide
Ask me questions while you tour the home.