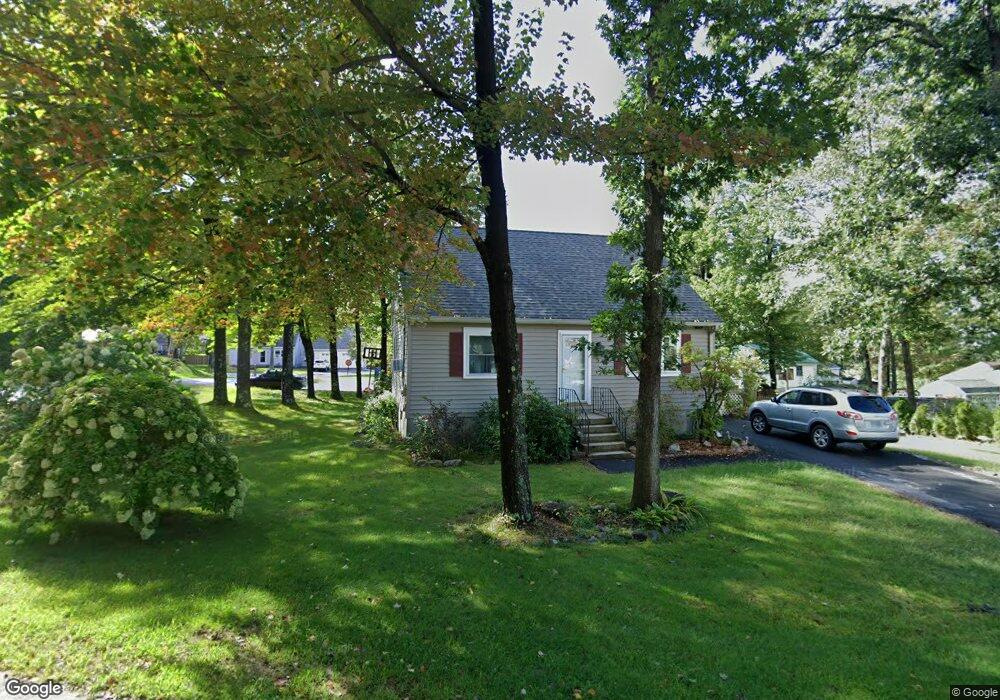
5 Howe St Allenstown, NH 03275
Suncook NeighborhoodEstimated Value: $367,000 - $430,000
2
Beds
1
Bath
1,186
Sq Ft
$330/Sq Ft
Est. Value
About This Home
This home is located at 5 Howe St, Allenstown, NH 03275 and is currently estimated at $391,279, approximately $329 per square foot. 5 Howe St is a home located in Merrimack County with nearby schools including Allenstown Elementary School, Armand R. Dupont School, and Tender Years Child Care & Learning Center.
Ownership History
Date
Name
Owned For
Owner Type
Purchase Details
Closed on
Dec 3, 2018
Sold by
Mcgee Kimberly D
Bought by
Maloney Elisha R
Current Estimated Value
Home Financials for this Owner
Home Financials are based on the most recent Mortgage that was taken out on this home.
Original Mortgage
$206,196
Outstanding Balance
$181,917
Interest Rate
4.87%
Mortgage Type
FHA
Estimated Equity
$209,362
Purchase Details
Closed on
Dec 12, 2006
Sold by
Carrier Jason J and Carrier Suzanne E
Bought by
Mcgee Kimberly D and Mcgee Thomas F
Home Financials for this Owner
Home Financials are based on the most recent Mortgage that was taken out on this home.
Original Mortgage
$208,150
Interest Rate
6.4%
Create a Home Valuation Report for This Property
The Home Valuation Report is an in-depth analysis detailing your home's value as well as a comparison with similar homes in the area
Home Values in the Area
Average Home Value in this Area
Purchase History
| Date | Buyer | Sale Price | Title Company |
|---|---|---|---|
| Maloney Elisha R | $210,000 | -- | |
| Mcgee Kimberly D | $208,200 | -- | |
| Mcgee Kimberl D | $208,200 | -- |
Source: Public Records
Mortgage History
| Date | Status | Borrower | Loan Amount |
|---|---|---|---|
| Open | Maloney Elisha R | $206,196 | |
| Previous Owner | Mcgee Kimberly D | $207,233 | |
| Previous Owner | Mcgee Kimberl D | $208,150 |
Source: Public Records
Tax History Compared to Growth
Tax History
| Year | Tax Paid | Tax Assessment Tax Assessment Total Assessment is a certain percentage of the fair market value that is determined by local assessors to be the total taxable value of land and additions on the property. | Land | Improvement |
|---|---|---|---|---|
| 2024 | $7,547 | $296,900 | $145,200 | $151,700 |
| 2023 | $6,294 | $296,900 | $145,200 | $151,700 |
| 2022 | $5,790 | $296,900 | $145,200 | $151,700 |
| 2021 | $5,538 | $175,800 | $86,600 | $89,200 |
| 2020 | $5,151 | $175,800 | $86,600 | $89,200 |
| 2019 | $5,228 | $168,100 | $82,500 | $85,600 |
| 2018 | $5,068 | $168,100 | $82,500 | $85,600 |
| 2017 | $5,398 | $168,100 | $82,500 | $85,600 |
| 2016 | $4,710 | $139,100 | $60,000 | $79,100 |
| 2015 | $4,567 | $139,100 | $60,000 | $79,100 |
| 2014 | $4,692 | $138,900 | $60,000 | $78,900 |
| 2013 | $4,380 | $138,900 | $60,000 | $78,900 |
Source: Public Records
Map
Nearby Homes
- 422 Dawn Dr Unit 23
- 427 Dawn Dr Unit 15
- 15 Main St
- 19 Sullivan Dr
- 4 Rodger Rd
- 10 Lane Dr
- 1 1/2 Bartlett St
- 7 Ferry St
- 2 Cheryl Dr
- 111 Glass St
- 100 Main St Unit M10
- 100 Main St Unit 204
- 12-14 Church St Unit 12,14
- 15 Sullivan Dr
- 1821 Hooksett Rd
- 10 Northview Terrace
- 307 Dearborn Rd
- 14 Manor Dr Unit D
- 12 Manor Dr Unit B
- 233 Pembroke St