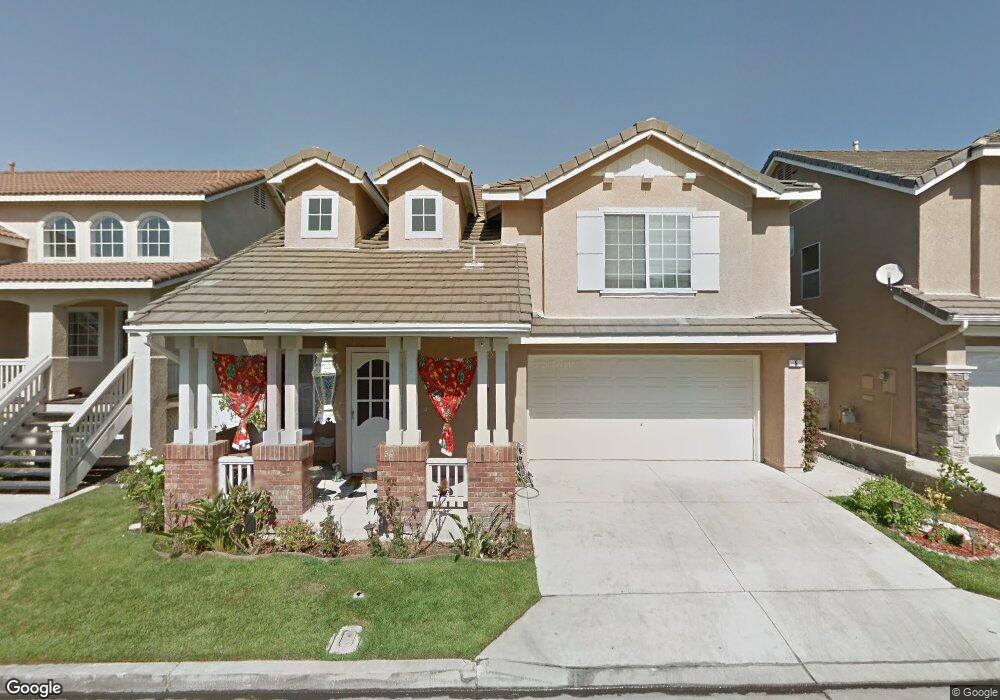
5 Jameson Foothill Ranch, CA 92610
Estimated Value: $1,164,000 - $1,288,000
4
Beds
3
Baths
1,808
Sq Ft
$671/Sq Ft
Est. Value
About This Home
This home is located at 5 Jameson, Foothill Ranch, CA 92610 and is currently estimated at $1,213,847, approximately $671 per square foot. 5 Jameson is a home located in Orange County with nearby schools including Foothill Ranch Elementary School, Rancho Santa Margarita Intermediate School, and Trabuco Hills High School.
Ownership History
Date
Name
Owned For
Owner Type
Purchase Details
Closed on
Feb 14, 2007
Sold by
Khalil Nenmin K
Bought by
Younis Waleed K
Current Estimated Value
Home Financials for this Owner
Home Financials are based on the most recent Mortgage that was taken out on this home.
Original Mortgage
$536,000
Outstanding Balance
$314,460
Interest Rate
6.25%
Mortgage Type
Purchase Money Mortgage
Estimated Equity
$899,387
Purchase Details
Closed on
Jan 22, 2007
Sold by
Baker Dean A
Bought by
Younis Waleed M
Home Financials for this Owner
Home Financials are based on the most recent Mortgage that was taken out on this home.
Original Mortgage
$536,000
Outstanding Balance
$314,460
Interest Rate
6.25%
Mortgage Type
Purchase Money Mortgage
Estimated Equity
$899,387
Purchase Details
Closed on
Sep 17, 2003
Sold by
Graham Todd and Graham Dee Ann
Bought by
Baker Dean A
Home Financials for this Owner
Home Financials are based on the most recent Mortgage that was taken out on this home.
Original Mortgage
$413,600
Interest Rate
5.25%
Mortgage Type
Purchase Money Mortgage
Purchase Details
Closed on
Aug 27, 1997
Sold by
Jacobsen Joel E and Jacobsen Lisa B
Bought by
Graham Todd and Graham Dee Ann
Home Financials for this Owner
Home Financials are based on the most recent Mortgage that was taken out on this home.
Original Mortgage
$164,000
Interest Rate
6.75%
Purchase Details
Closed on
Jan 30, 1996
Sold by
Kaufman & Broad Coastal Inc
Bought by
Jacobsen Joel E and Jacobsen Lisa B
Home Financials for this Owner
Home Financials are based on the most recent Mortgage that was taken out on this home.
Original Mortgage
$187,100
Interest Rate
7.25%
Mortgage Type
Seller Take Back
Create a Home Valuation Report for This Property
The Home Valuation Report is an in-depth analysis detailing your home's value as well as a comparison with similar homes in the area
Home Values in the Area
Average Home Value in this Area
Purchase History
| Date | Buyer | Sale Price | Title Company |
|---|---|---|---|
| Younis Waleed K | -- | New Century Title Company | |
| Younis Waleed M | $670,000 | New Century Title Company | |
| Baker Dean A | $517,000 | First American Title Company | |
| Graham Todd | $205,000 | Orange Coast Title | |
| Jacobsen Joel E | $197,000 | First American Title Ins Co |
Source: Public Records
Mortgage History
| Date | Status | Borrower | Loan Amount |
|---|---|---|---|
| Open | Younis Waleed M | $536,000 | |
| Previous Owner | Baker Dean A | $413,600 | |
| Previous Owner | Graham Todd | $164,000 | |
| Previous Owner | Jacobsen Joel E | $187,100 | |
| Closed | Baker Dean A | $51,700 |
Source: Public Records
Tax History
| Year | Tax Paid | Tax Assessment Tax Assessment Total Assessment is a certain percentage of the fair market value that is determined by local assessors to be the total taxable value of land and additions on the property. | Land | Improvement |
|---|---|---|---|---|
| 2025 | $9,156 | $897,651 | $581,952 | $315,699 |
| 2024 | $9,156 | $880,050 | $570,541 | $309,509 |
| 2023 | $8,939 | $862,795 | $559,354 | $303,441 |
| 2022 | $8,462 | $814,980 | $548,386 | $266,594 |
| 2021 | $7,673 | $799,000 | $537,634 | $261,366 |
| 2020 | $7,519 | $724,000 | $488,358 | $235,642 |
| 2019 | $7,516 | $724,000 | $488,358 | $235,642 |
| 2018 | $7,523 | $724,000 | $488,358 | $235,642 |
| 2017 | $7,088 | $683,000 | $447,358 | $235,642 |
| 2016 | $7,107 | $616,000 | $380,358 | $235,642 |
| 2015 | $7,168 | $616,000 | $380,358 | $235,642 |
| 2014 | $7,261 | $565,267 | $329,625 | $235,642 |
Source: Public Records
Map
Nearby Homes
Your Personal Tour Guide
Ask me questions while you tour the home.