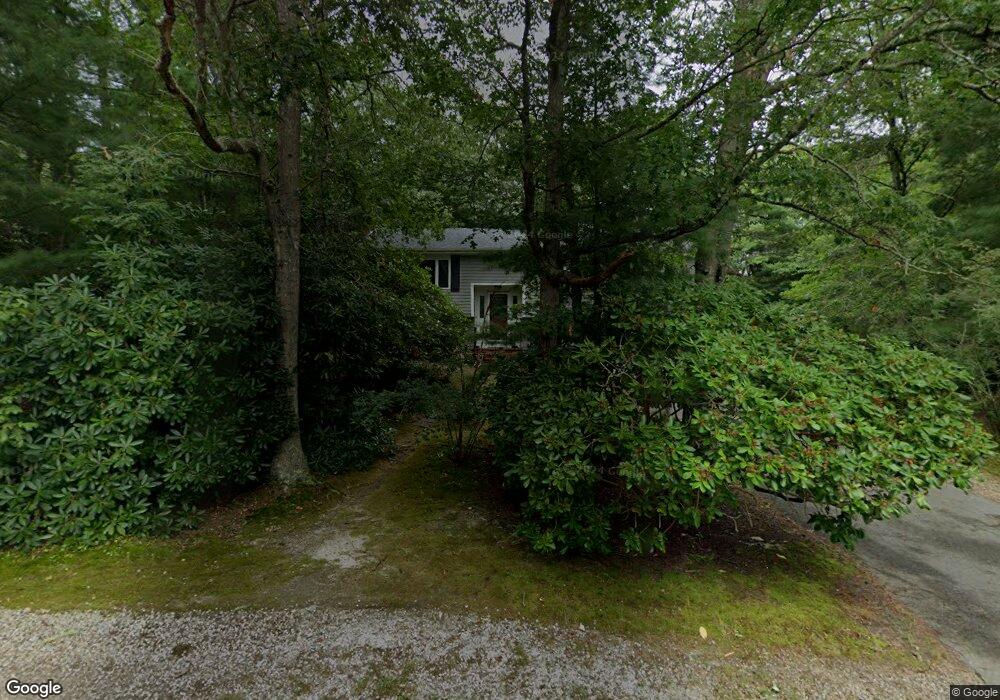
5 Keith Rd Pocasset, MA 02559
Pocasset NeighborhoodEstimated Value: $613,000 - $709,000
3
Beds
2
Baths
1,501
Sq Ft
$440/Sq Ft
Est. Value
About This Home
This home is located at 5 Keith Rd, Pocasset, MA 02559 and is currently estimated at $660,170, approximately $439 per square foot. 5 Keith Rd is a home located in Barnstable County with nearby schools including Bourne High School and Cadence Academy Preschool - Bourne.
Ownership History
Date
Name
Owned For
Owner Type
Purchase Details
Closed on
Feb 3, 2010
Sold by
Jones Vann G C and Jones Felicia M
Bought by
Jones Felicia M and Jones Vann G
Current Estimated Value
Home Financials for this Owner
Home Financials are based on the most recent Mortgage that was taken out on this home.
Original Mortgage
$268,976
Outstanding Balance
$175,368
Interest Rate
5.05%
Mortgage Type
FHA
Estimated Equity
$484,802
Purchase Details
Closed on
Apr 12, 2000
Sold by
Brady Kenneth J and Brady Judy Guarino
Bought by
Jones Vann G and Karvonen Felicia M
Create a Home Valuation Report for This Property
The Home Valuation Report is an in-depth analysis detailing your home's value as well as a comparison with similar homes in the area
Home Values in the Area
Average Home Value in this Area
Purchase History
| Date | Buyer | Sale Price | Title Company |
|---|---|---|---|
| Jones Felicia M | -- | -- | |
| Jones Felicia M | -- | -- | |
| Jones Felicia M | -- | -- | |
| Jones Vann G | $165,000 | -- | |
| Jones Vann G | $165,000 | -- |
Source: Public Records
Mortgage History
| Date | Status | Borrower | Loan Amount |
|---|---|---|---|
| Open | Jones Felicia M | $268,976 | |
| Closed | Jones Vann G | $268,976 |
Source: Public Records
Tax History
| Year | Tax Paid | Tax Assessment Tax Assessment Total Assessment is a certain percentage of the fair market value that is determined by local assessors to be the total taxable value of land and additions on the property. | Land | Improvement |
|---|---|---|---|---|
| 2025 | $4,178 | $535,000 | $224,300 | $310,700 |
| 2024 | $4,020 | $501,200 | $213,600 | $287,600 |
| 2023 | $3,874 | $439,700 | $180,900 | $258,800 |
| 2022 | $4,075 | $403,900 | $196,400 | $207,500 |
| 2021 | $3,973 | $368,900 | $178,800 | $190,100 |
| 2020 | $3,861 | $359,500 | $177,100 | $182,400 |
| 2019 | $3,681 | $350,200 | $177,100 | $173,100 |
| 2018 | $3,618 | $343,300 | $168,600 | $174,700 |
| 2017 | $3,375 | $327,700 | $154,700 | $173,000 |
| 2016 | $3,059 | $301,100 | $154,700 | $146,400 |
| 2015 | $3,065 | $304,400 | $154,700 | $149,700 |
Source: Public Records
Map
Nearby Homes
- 16 Michael Rd
- 254 Barlows Landing Rd
- 709 County Rd
- 3 4th Ave
- 7 4th Ave
- 3 1st St
- 14 Navajo Rd
- 48 Red Brook Harbor Rd
- 566 Shore Rd
- 1234 Route 28a
- 1234 Route 28a
- 20 Colony Ave
- 15 Oak Ave
- 75 Winsor Rd
- 4 Harbor Hill Dr
- 16 Amberwood Ct
- 31 Baxendale Rd
- 203 County Rd
- 12 Turnberry Rd Unit 12
- 4 Hollyhock Knoll Ct Unit 4
Your Personal Tour Guide
Ask me questions while you tour the home.