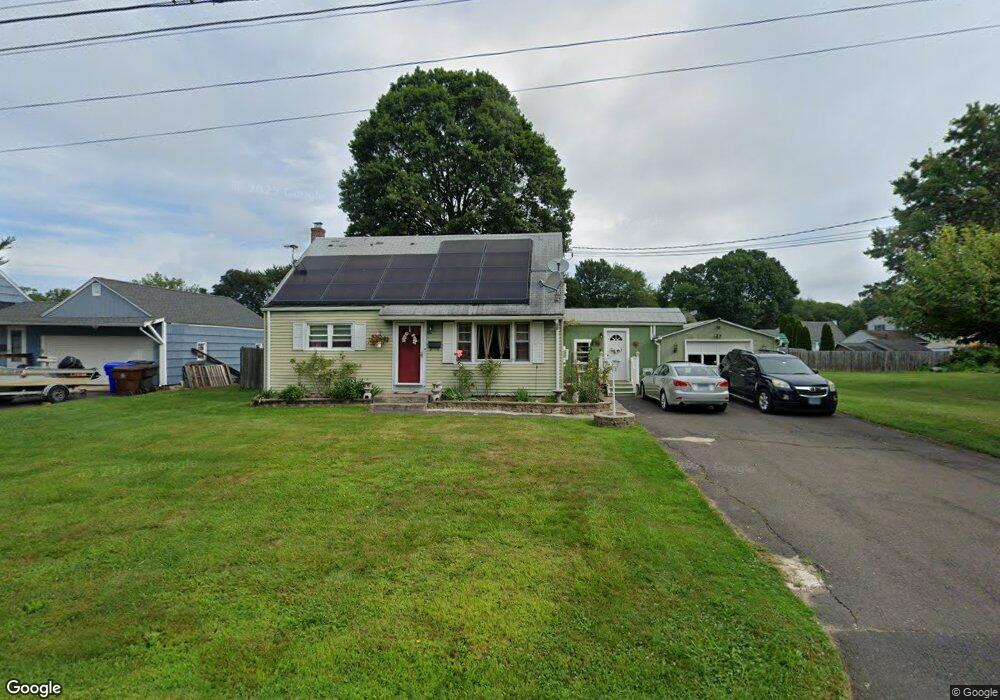
5 Leonard Rd Enfield, CT 06082
Estimated Value: $282,395 - $312,000
4
Beds
1
Bath
1,152
Sq Ft
$258/Sq Ft
Est. Value
About This Home
This home is located at 5 Leonard Rd, Enfield, CT 06082 and is currently estimated at $297,349, approximately $258 per square foot. 5 Leonard Rd is a home located in Hartford County with nearby schools including Prudence Crandall Elementary School, Henry Barnard Elementary School, and Enfield High School.
Ownership History
Date
Name
Owned For
Owner Type
Purchase Details
Closed on
Jan 29, 1999
Sold by
Sarno Kathleen
Bought by
Coito Henrique and Coito Silvia
Current Estimated Value
Home Financials for this Owner
Home Financials are based on the most recent Mortgage that was taken out on this home.
Original Mortgage
$102,941
Interest Rate
6.67%
Purchase Details
Closed on
Jul 31, 1998
Sold by
Fnma
Bought by
Sarno Kathleen
Home Financials for this Owner
Home Financials are based on the most recent Mortgage that was taken out on this home.
Original Mortgage
$50,000
Interest Rate
6.92%
Mortgage Type
Purchase Money Mortgage
Purchase Details
Closed on
Nov 13, 1989
Sold by
Fsch Jeffrey
Bought by
Bean Craig
Home Financials for this Owner
Home Financials are based on the most recent Mortgage that was taken out on this home.
Original Mortgage
$98,000
Interest Rate
10.03%
Create a Home Valuation Report for This Property
The Home Valuation Report is an in-depth analysis detailing your home's value as well as a comparison with similar homes in the area
Home Values in the Area
Average Home Value in this Area
Purchase History
| Date | Buyer | Sale Price | Title Company |
|---|---|---|---|
| Coito Henrique | $103,500 | -- | |
| Sarno Kathleen | $70,000 | -- | |
| Bean Craig | $134,900 | -- |
Source: Public Records
Mortgage History
| Date | Status | Borrower | Loan Amount |
|---|---|---|---|
| Closed | Bean Craig | $110,000 | |
| Closed | Bean Craig | $102,941 | |
| Previous Owner | Bean Craig | $50,000 | |
| Previous Owner | Bean Craig | $98,000 |
Source: Public Records
Tax History
| Year | Tax Paid | Tax Assessment Tax Assessment Total Assessment is a certain percentage of the fair market value that is determined by local assessors to be the total taxable value of land and additions on the property. | Land | Improvement |
|---|---|---|---|---|
| 2025 | $4,591 | $132,500 | $47,300 | $85,200 |
| 2024 | $4,480 | $132,500 | $47,300 | $85,200 |
| 2023 | $4,407 | $132,500 | $47,300 | $85,200 |
| 2022 | $4,053 | $132,500 | $47,300 | $85,200 |
| 2021 | $3,677 | $98,380 | $39,220 | $59,160 |
| 2020 | $3,677 | $98,380 | $39,220 | $59,160 |
| 2019 | $3,677 | $98,380 | $39,220 | $59,160 |
| 2018 | $3,596 | $98,380 | $39,220 | $59,160 |
| 2017 | $3,402 | $98,380 | $39,220 | $59,160 |
| 2016 | $3,297 | $96,940 | $39,220 | $57,720 |
| 2015 | $3,203 | $96,940 | $39,220 | $57,720 |
| 2014 | $3,129 | $96,940 | $39,220 | $57,720 |
Source: Public Records
Map
Nearby Homes
- 9 Foxcroft Rd
- 73 Laurel St
- 9 Virginia Ave
- 23 Woodlawn Ave
- 25 Woodlawn Ave
- 64 Hartford Ave
- 54 Hartford Ave
- 39 Union Street Extension
- 20 Manning Rd
- 127 Windsor St
- 15 Summer St
- 148 Pleasant St
- 97 Pleasant St
- 30-32 Church St
- 26-28 Church St
- 35 Bernardino Ave
- 11 Willard Ave
- 2 Sharren Ln
- 40 Church St
- 24 Ohear Ave
Your Personal Tour Guide
Ask me questions while you tour the home.