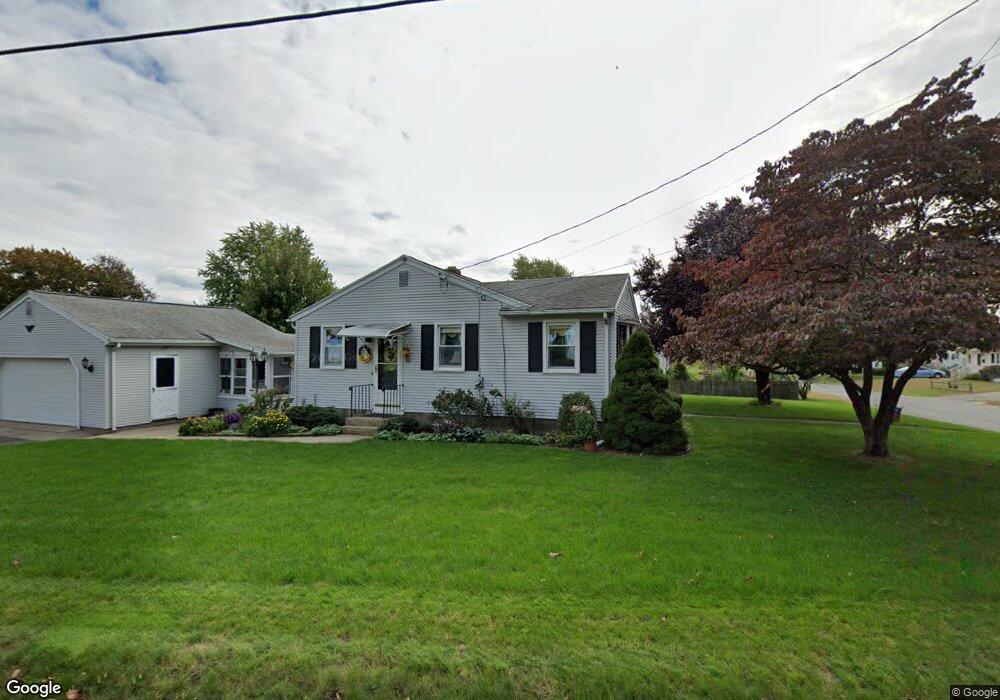
5 Lorimer St Chicopee, MA 01013
Sandy Hill NeighborhoodEstimated Value: $295,613 - $352,000
3
Beds
1
Bath
955
Sq Ft
$327/Sq Ft
Est. Value
About This Home
This home is located at 5 Lorimer St, Chicopee, MA 01013 and is currently estimated at $312,403, approximately $327 per square foot. 5 Lorimer St is a home located in Hampden County with nearby schools including Barry Elementary School, Bellamy Middle School, and Chicopee High School.
Ownership History
Date
Name
Owned For
Owner Type
Purchase Details
Closed on
Oct 26, 1989
Sold by
Godin Albert J
Bought by
Strange Thomas M
Current Estimated Value
Home Financials for this Owner
Home Financials are based on the most recent Mortgage that was taken out on this home.
Original Mortgage
$107,000
Interest Rate
9.94%
Mortgage Type
Purchase Money Mortgage
Create a Home Valuation Report for This Property
The Home Valuation Report is an in-depth analysis detailing your home's value as well as a comparison with similar homes in the area
Home Values in the Area
Average Home Value in this Area
Purchase History
| Date | Buyer | Sale Price | Title Company |
|---|---|---|---|
| Strange Thomas M | $127,000 | -- |
Source: Public Records
Mortgage History
| Date | Status | Borrower | Loan Amount |
|---|---|---|---|
| Open | Strange Thomas M | $28,000 | |
| Closed | Strange Thomas M | $108,500 | |
| Closed | Strange Thomas M | $107,000 | |
| Previous Owner | Strange Thomas M | $20,000 |
Source: Public Records
Tax History
| Year | Tax Paid | Tax Assessment Tax Assessment Total Assessment is a certain percentage of the fair market value that is determined by local assessors to be the total taxable value of land and additions on the property. | Land | Improvement |
|---|---|---|---|---|
| 2025 | $3,675 | $242,400 | $108,200 | $134,200 |
| 2024 | $3,491 | $236,500 | $106,000 | $130,500 |
| 2023 | $3,254 | $214,800 | $96,400 | $118,400 |
| 2022 | $3,184 | $187,400 | $83,800 | $103,600 |
| 2021 | $3,031 | $172,100 | $76,200 | $95,900 |
| 2020 | $2,942 | $168,500 | $78,300 | $90,200 |
| 2019 | $2,922 | $162,700 | $78,300 | $84,400 |
| 2018 | $2,855 | $155,900 | $74,500 | $81,400 |
| 2017 | $2,752 | $159,000 | $68,800 | $90,200 |
| 2016 | $2,646 | $156,500 | $68,800 | $87,700 |
| 2015 | $2,656 | $151,400 | $68,800 | $82,600 |
| 2014 | $1,328 | $151,400 | $68,800 | $82,600 |
Source: Public Records
Map
Nearby Homes
- 0 Nelson St
- 109 Church St
- 438 Front St
- 45 Hastings St
- 35 Lower Grape St
- 85 Orchard St
- 26 Belcher St
- 23 Jackson St
- 29 Sunnymeade Ave
- 238 E Main St
- 95 Washington St
- 156 East St
- 60 Hawthorn St
- 15 Hyde Ave
- 57- 59 Stearns Terrace
- 101 Huntington Ave
- 57 Colonial Cir Unit D
- 541 Grattan St
- 30 Butler Ave
- 2 Marion St
Your Personal Tour Guide
Ask me questions while you tour the home.