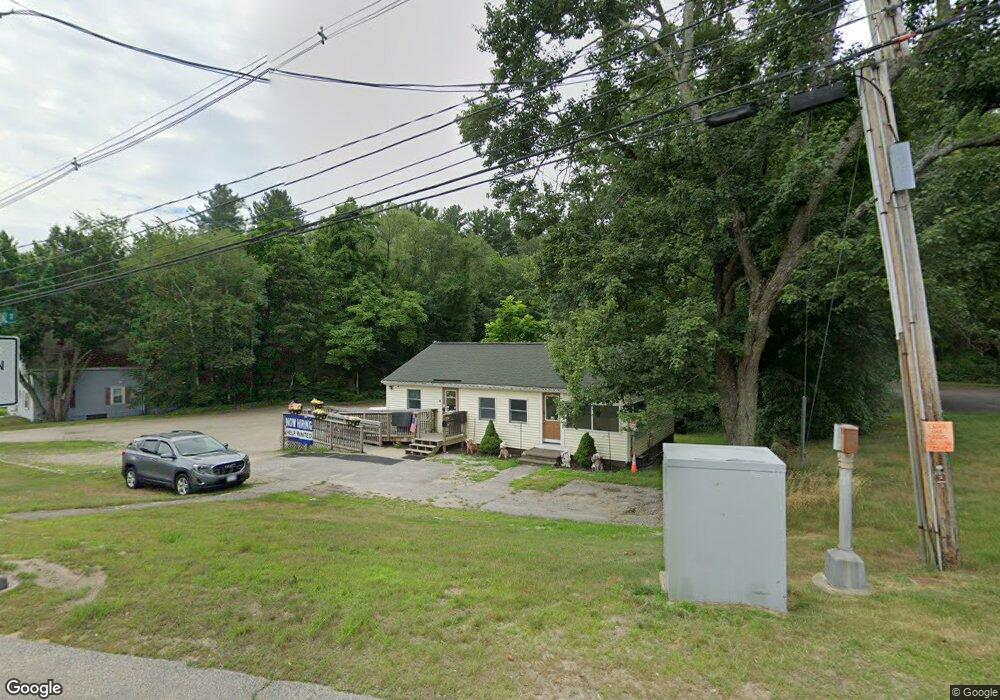
5 Lowell Rd Hudson, NH 03051
Estimated Value: $300,723
Studio
--
Bath
912
Sq Ft
$330/Sq Ft
Est. Value
About This Home
This home is located at 5 Lowell Rd, Hudson, NH 03051 and is currently estimated at $300,723, approximately $329 per square foot. 5 Lowell Rd is a home located in Hillsborough County with nearby schools including Nottingham West Elementary School, Hudson Memorial School, and Alvirne High School.
Ownership History
Date
Name
Owned For
Owner Type
Purchase Details
Closed on
Feb 12, 2015
Sold by
Ascolillo Louie R
Bought by
Parent Kristeen
Current Estimated Value
Purchase Details
Closed on
May 28, 2002
Sold by
Charbonneau Claude M and Charbonneau Rhona M
Bought by
Canobie Corners Mgmt S
Home Financials for this Owner
Home Financials are based on the most recent Mortgage that was taken out on this home.
Original Mortgage
$100,000
Interest Rate
7.01%
Mortgage Type
Commercial
Create a Home Valuation Report for This Property
The Home Valuation Report is an in-depth analysis detailing your home's value as well as a comparison with similar homes in the area
Home Values in the Area
Average Home Value in this Area
Purchase History
| Date | Buyer | Sale Price | Title Company |
|---|---|---|---|
| Parent Kristeen | -- | -- | |
| Canobie Corners Mgmt S | $110,000 | -- |
Source: Public Records
Mortgage History
| Date | Status | Borrower | Loan Amount |
|---|---|---|---|
| Previous Owner | Canobie Corners Mgmt S | $100,000 |
Source: Public Records
Tax History
| Year | Tax Paid | Tax Assessment Tax Assessment Total Assessment is a certain percentage of the fair market value that is determined by local assessors to be the total taxable value of land and additions on the property. | Land | Improvement |
|---|---|---|---|---|
| 2025 | $3,499 | $204,500 | $113,300 | $91,200 |
| 2024 | $3,364 | $204,500 | $113,300 | $91,200 |
| 2023 | $3,207 | $204,500 | $113,300 | $91,200 |
| 2022 | $3,004 | $204,500 | $113,300 | $91,200 |
| 2021 | $3,586 | $165,500 | $82,200 | $83,300 |
| 2020 | $3,537 | $165,500 | $82,200 | $83,300 |
| 2019 | $3,356 | $165,500 | $82,200 | $83,300 |
| 2018 | $3,128 | $155,600 | $82,200 | $73,400 |
| 2017 | $3,066 | $155,500 | $82,200 | $73,300 |
| 2016 | $3,219 | $146,500 | $82,200 | $64,300 |
| 2015 | $3,113 | $146,500 | $82,200 | $64,300 |
| 2014 | $3,052 | $146,500 | $82,200 | $64,300 |
| 2013 | $3,012 | $146,500 | $82,200 | $64,300 |
Source: Public Records
Map
Nearby Homes
Your Personal Tour Guide
Ask me questions while you tour the home.