
Seller's Agent in 2026
Lee Joseph
Coldwell Banker Realty - Worcester
(508) 847-6017
16 in this area
270 Total Sales

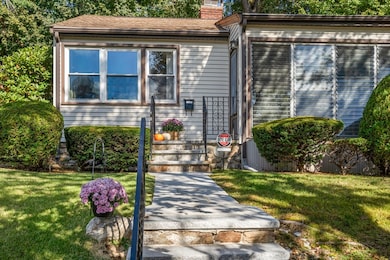
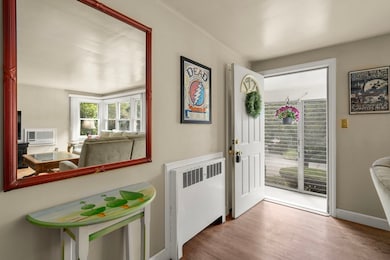
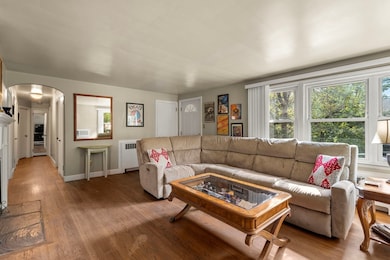
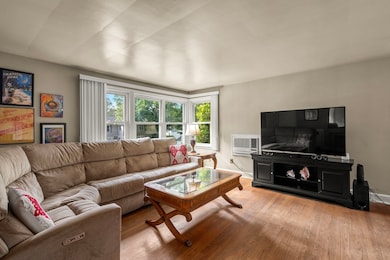
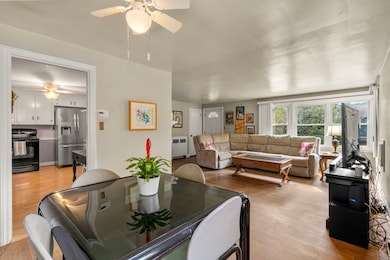
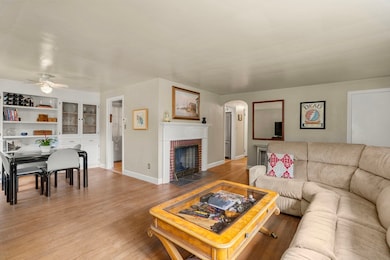
This charming West Side ranch sits at the end of a quiet dead-end street, offering privacy with easy access to everything Worcester has to offer. The open floor plan includes a fireplaced living room, a dining room with built-ins, and an enclosed porch off the kitchen that opens to the rear yard with its beautiful natural stone wall—a true New England touch. Hardwood floors run through most common areas and bedrooms. A welcoming screened porch shelters the entry from the weather and provides a wonderful morning spot for your coffee. Improvements made include vinyl siding, architectural shingle roof, gutters, boiler, and oil tank including "tank guard". Conveniently located near Salisbury Street, schools, parks, restaurants, and highways, and just minutes from cultural venues, two hospitals, 10 colleges, and sports including the WooSox!
| Date | Type | Sale Price | Title Company |
|---|---|---|---|
| Quit Claim Deed | $375,000 | -- | |
| Deed | -- | -- | |
| Deed | $101,000 | -- |
| Date | Status | Loan Amount | Loan Type |
|---|---|---|---|
| Open | $339,875 | New Conventional | |
| Previous Owner | $105,000 | No Value Available | |
| Previous Owner | $10,000 | No Value Available | |
| Previous Owner | $9,000 | No Value Available |
| Date | Event | Price | List to Sale | Price per Sq Ft |
|---|---|---|---|---|
| 01/09/2026 01/09/26 | Sold | $375,000 | -6.2% | $338 / Sq Ft |
| 11/22/2025 11/22/25 | Pending | -- | -- | -- |
| 10/29/2025 10/29/25 | Price Changed | $399,999 | -2.4% | $361 / Sq Ft |
| 10/16/2025 10/16/25 | Price Changed | $409,900 | -2.4% | $370 / Sq Ft |
| 10/02/2025 10/02/25 | Price Changed | $419,999 | -2.3% | $379 / Sq Ft |
| 09/23/2025 09/23/25 | For Sale | $430,000 | -- | $388 / Sq Ft |
| Year | Tax Paid | Tax Assessment Tax Assessment Total Assessment is a certain percentage of the fair market value that is determined by local assessors to be the total taxable value of land and additions on the property. | Land | Improvement |
|---|---|---|---|---|
| 2025 | $4,489 | $340,300 | $118,800 | $221,500 |
| 2024 | $4,406 | $320,400 | $118,800 | $201,600 |
| 2023 | $4,246 | $296,100 | $103,300 | $192,800 |
| 2022 | $3,752 | $246,700 | $82,700 | $164,000 |
| 2021 | $3,759 | $230,900 | $66,100 | $164,800 |
| 2020 | $3,616 | $212,700 | $66,100 | $146,600 |
| 2019 | $3,400 | $188,900 | $59,600 | $129,300 |
| 2018 | $3,304 | $174,700 | $59,600 | $115,100 |
| 2017 | $3,358 | $174,700 | $59,600 | $115,100 |
| 2016 | $3,261 | $158,200 | $43,900 | $114,300 |
| 2015 | $3,175 | $158,200 | $43,900 | $114,300 |
| 2014 | $3,093 | $158,300 | $43,900 | $114,400 |
Seller's Agent in 2026
Lee Joseph
Coldwell Banker Realty - Worcester
(508) 847-6017
16 in this area
270 Total Sales
Buyer's Agent in 2026
Sharon Ridley
StartPoint Realty
(774) 287-0405
3 in this area
93 Total Sales
Source: MLS Property Information Network (MLS PIN)
MLS Number: 73432427
APN: WORC-000043-000009-000006A
Disclaimer: Certain information contained herein is derived from information provided by parties other than Homes.com. All information provided is deemed reliable, but is not guaranteed to be accurate and should be independently verified.
![]() The property listing data and information, or the Images, set forth herein were provided to MLS Property Information Network, Inc. from third party sources, including sellers, lessors and public records, and were compiled by MLS Property Information Network, Inc. The property listing data and information, and the Images, are for the personal, non-commercial use of consumers having a good faith interest in purchasing or leasing listed properties of the type displayed to them and may not be used for any purpose other than to identify prospective properties which such consumers may have a good faith interest in purchasing or leasing. MLS Property Information Network, Inc. and its subscribers disclaim any and all representations and warranties as to the accuracy of the property listing data and information, or as to the accuracy of any of the Images, set forth herein.
The property listing data and information, or the Images, set forth herein were provided to MLS Property Information Network, Inc. from third party sources, including sellers, lessors and public records, and were compiled by MLS Property Information Network, Inc. The property listing data and information, and the Images, are for the personal, non-commercial use of consumers having a good faith interest in purchasing or leasing listed properties of the type displayed to them and may not be used for any purpose other than to identify prospective properties which such consumers may have a good faith interest in purchasing or leasing. MLS Property Information Network, Inc. and its subscribers disclaim any and all representations and warranties as to the accuracy of the property listing data and information, or as to the accuracy of any of the Images, set forth herein.
Ask me questions while you tour the home.