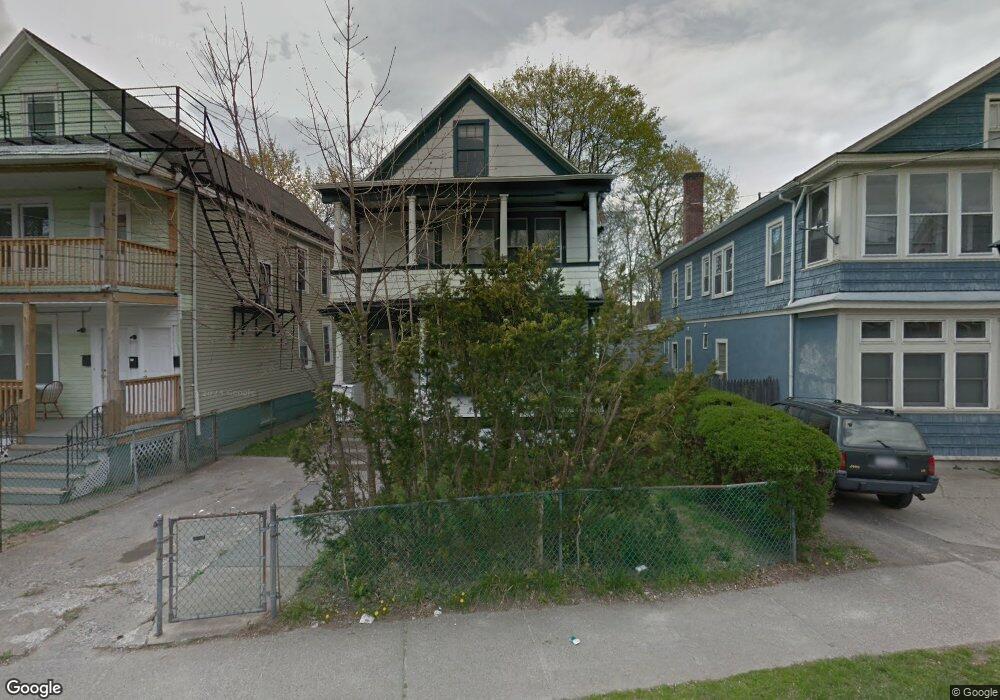
5 May St Unit 2 Poughkeepsie, NY 12603
Estimated Value: $342,000 - $386,269
2
Beds
1
Bath
1,100
Sq Ft
$339/Sq Ft
Est. Value
About This Home
This home is located at 5 May St Unit 2, Poughkeepsie, NY 12603 and is currently estimated at $373,317, approximately $339 per square foot. 5 May St Unit 2 is a home located in Dutchess County with nearby schools including Poughkeepsie High School, Holy Trinity School, and Tabernacle Christian Academy.
Ownership History
Date
Name
Owned For
Owner Type
Purchase Details
Closed on
Jul 9, 2024
Sold by
Herring David L
Bought by
Bennett Steve A and Bramwell Saleine R
Current Estimated Value
Home Financials for this Owner
Home Financials are based on the most recent Mortgage that was taken out on this home.
Original Mortgage
$333,841
Outstanding Balance
$329,589
Interest Rate
7.03%
Mortgage Type
FHA
Estimated Equity
$43,728
Purchase Details
Closed on
Mar 7, 2000
Sold by
Fokhouri Ibrahim
Bought by
Murphy James
Create a Home Valuation Report for This Property
The Home Valuation Report is an in-depth analysis detailing your home's value as well as a comparison with similar homes in the area
Home Values in the Area
Average Home Value in this Area
Purchase History
| Date | Buyer | Sale Price | Title Company |
|---|---|---|---|
| Bennett Steve A | $340,000 | New Millennium Title Group | |
| Murphy James | $80,000 | Michael J Derevlany | |
| Murphy James | $80,000 | Michael J Derevlany |
Source: Public Records
Mortgage History
| Date | Status | Borrower | Loan Amount |
|---|---|---|---|
| Open | Bennett Steve A | $333,841 |
Source: Public Records
Tax History
| Year | Tax Paid | Tax Assessment Tax Assessment Total Assessment is a certain percentage of the fair market value that is determined by local assessors to be the total taxable value of land and additions on the property. | Land | Improvement |
|---|---|---|---|---|
| 2024 | $8,059 | $345,200 | $59,400 | $285,800 |
| 2023 | $8,124 | $325,700 | $59,400 | $266,300 |
| 2022 | $6,322 | $271,400 | $54,000 | $217,400 |
| 2021 | $6,101 | $224,300 | $54,000 | $170,300 |
| 2020 | $6,247 | $186,900 | $54,000 | $132,900 |
| 2019 | $6,056 | $169,900 | $54,000 | $115,900 |
| 2018 | $5,710 | $161,800 | $54,000 | $107,800 |
| 2017 | $5,378 | $154,100 | $54,000 | $100,100 |
| 2016 | $5,162 | $171,200 | $54,000 | $117,200 |
| 2015 | -- | $171,200 | $54,000 | $117,200 |
| 2014 | -- | $166,200 | $54,000 | $112,200 |
Source: Public Records
Map
Nearby Homes
Your Personal Tour Guide
Ask me questions while you tour the home.