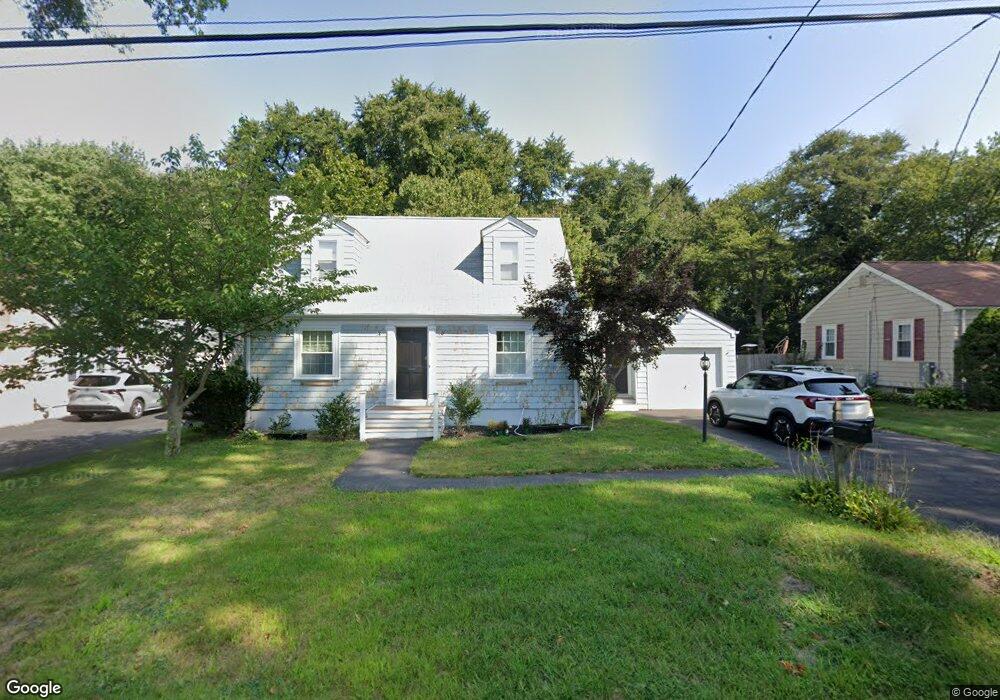
5 Milton Rd Barrington, RI 02806
North Barrington NeighborhoodEstimated Value: $593,000 - $618,000
3
Beds
2
Baths
1,356
Sq Ft
$443/Sq Ft
Est. Value
About This Home
This home is located at 5 Milton Rd, Barrington, RI 02806 and is currently estimated at $601,222, approximately $443 per square foot. 5 Milton Rd is a home located in Bristol County with nearby schools including Barrington High School, St Luke Elementary School, and Barrington Christian Academy.
Ownership History
Date
Name
Owned For
Owner Type
Purchase Details
Closed on
Aug 11, 2015
Sold by
Ghenta Michael
Bought by
Michael Ghenta Ret
Current Estimated Value
Purchase Details
Closed on
Oct 14, 2011
Sold by
Gardiner Christopher G and Gardiner Heather K
Bought by
Ghenta Michael
Purchase Details
Closed on
Nov 22, 1996
Sold by
Heffernon Irene E
Bought by
Gardiner Christopher G and Gardiner Heather
Create a Home Valuation Report for This Property
The Home Valuation Report is an in-depth analysis detailing your home's value as well as a comparison with similar homes in the area
Home Values in the Area
Average Home Value in this Area
Purchase History
| Date | Buyer | Sale Price | Title Company |
|---|---|---|---|
| Michael Ghenta Ret | -- | -- | |
| Ghenta Michael | $245,000 | -- | |
| Gardiner Christopher G | $130,000 | -- |
Source: Public Records
Mortgage History
| Date | Status | Borrower | Loan Amount |
|---|---|---|---|
| Previous Owner | Gardiner Christopher G | $208,000 | |
| Previous Owner | Gardiner Christopher G | $65,000 | |
| Previous Owner | Gardiner Christopher G | $123,600 |
Source: Public Records
Tax History Compared to Growth
Tax History
| Year | Tax Paid | Tax Assessment Tax Assessment Total Assessment is a certain percentage of the fair market value that is determined by local assessors to be the total taxable value of land and additions on the property. | Land | Improvement |
|---|---|---|---|---|
| 2025 | $7,164 | $467,000 | $256,000 | $211,000 |
| 2024 | $6,888 | $467,000 | $256,000 | $211,000 |
| 2023 | $7,227 | $356,000 | $142,000 | $214,000 |
| 2022 | $6,995 | $356,000 | $142,000 | $214,000 |
| 2021 | $6,817 | $356,000 | $142,000 | $214,000 |
| 2020 | $6,563 | $314,000 | $120,000 | $194,000 |
| 2019 | $6,311 | $314,000 | $120,000 | $194,000 |
| 2018 | $6,123 | $314,000 | $120,000 | $194,000 |
| 2017 | $5,848 | $292,400 | $119,500 | $172,900 |
| 2016 | $5,395 | $292,400 | $119,500 | $172,900 |
| 2015 | $5,336 | $292,400 | $119,500 | $172,900 |
| 2014 | -- | $262,400 | $121,900 | $140,500 |
Source: Public Records
Map
Nearby Homes