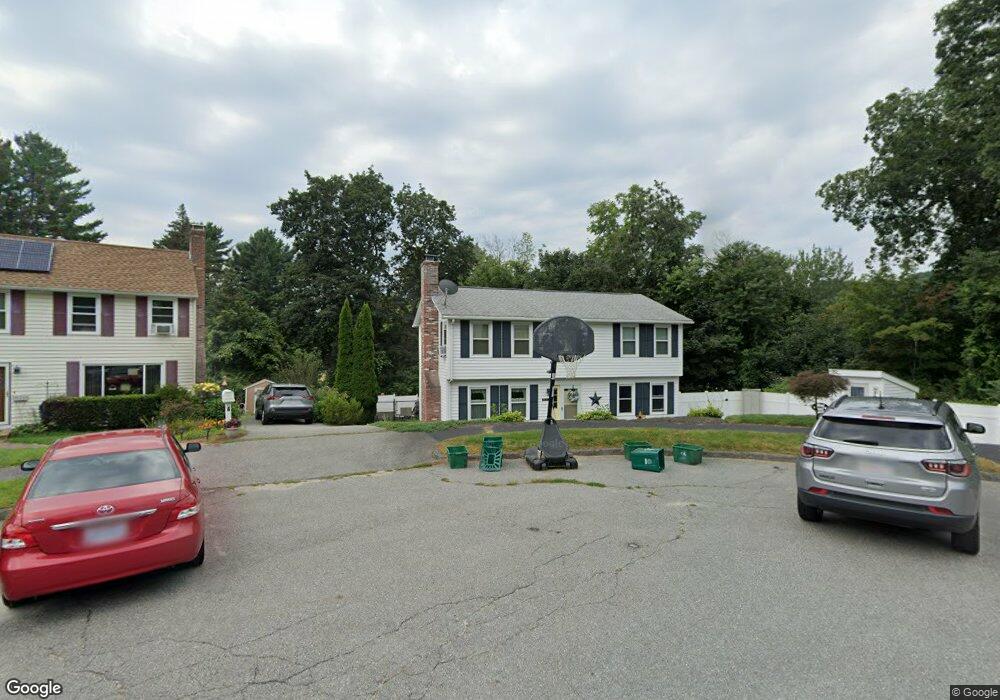
5 Moody St Worcester, MA 01606
Indian Hill NeighborhoodEstimated Value: $507,642 - $553,000
4
Beds
2
Baths
1,836
Sq Ft
$288/Sq Ft
Est. Value
About This Home
This home is located at 5 Moody St, Worcester, MA 01606 and is currently estimated at $527,911, approximately $287 per square foot. 5 Moody St is a home located in Worcester County with nearby schools including Nelson Place Elementary School, Chandler Magnet, and Jacob Hiatt Magnet School.
Ownership History
Date
Name
Owned For
Owner Type
Purchase Details
Closed on
Jul 31, 2000
Sold by
Gale John J and Gale Mary E
Bought by
Sullivan Kimberly A and Sullivan Joseph F
Current Estimated Value
Purchase Details
Closed on
May 30, 2000
Sold by
Moussette Kris A and Moussette Jonathan P
Bought by
Gale John J and Gale Mary E
Create a Home Valuation Report for This Property
The Home Valuation Report is an in-depth analysis detailing your home's value as well as a comparison with similar homes in the area
Home Values in the Area
Average Home Value in this Area
Purchase History
| Date | Buyer | Sale Price | Title Company |
|---|---|---|---|
| Sullivan Kimberly A | $174,000 | -- | |
| Gale John J | $178,000 | -- |
Source: Public Records
Mortgage History
| Date | Status | Borrower | Loan Amount |
|---|---|---|---|
| Open | Gale John J | $180,000 | |
| Closed | Gale John J | $185,000 |
Source: Public Records
Tax History
| Year | Tax Paid | Tax Assessment Tax Assessment Total Assessment is a certain percentage of the fair market value that is determined by local assessors to be the total taxable value of land and additions on the property. | Land | Improvement |
|---|---|---|---|---|
| 2025 | $5,928 | $449,400 | $118,100 | $331,300 |
| 2024 | $5,796 | $421,500 | $118,100 | $303,400 |
| 2023 | $5,574 | $388,700 | $102,700 | $286,000 |
| 2022 | $5,196 | $341,600 | $82,200 | $259,400 |
| 2021 | $5,094 | $312,900 | $65,700 | $247,200 |
| 2020 | $4,925 | $289,700 | $65,700 | $224,000 |
| 2019 | $4,741 | $263,400 | $59,100 | $204,300 |
| 2018 | $4,707 | $248,900 | $59,100 | $189,800 |
| 2017 | $4,501 | $234,200 | $59,100 | $175,100 |
| 2016 | $4,489 | $217,800 | $43,100 | $174,700 |
| 2015 | $4,371 | $217,800 | $43,100 | $174,700 |
| 2014 | $4,256 | $217,800 | $43,100 | $174,700 |
Source: Public Records
Map
Nearby Homes
Your Personal Tour Guide
Ask me questions while you tour the home.