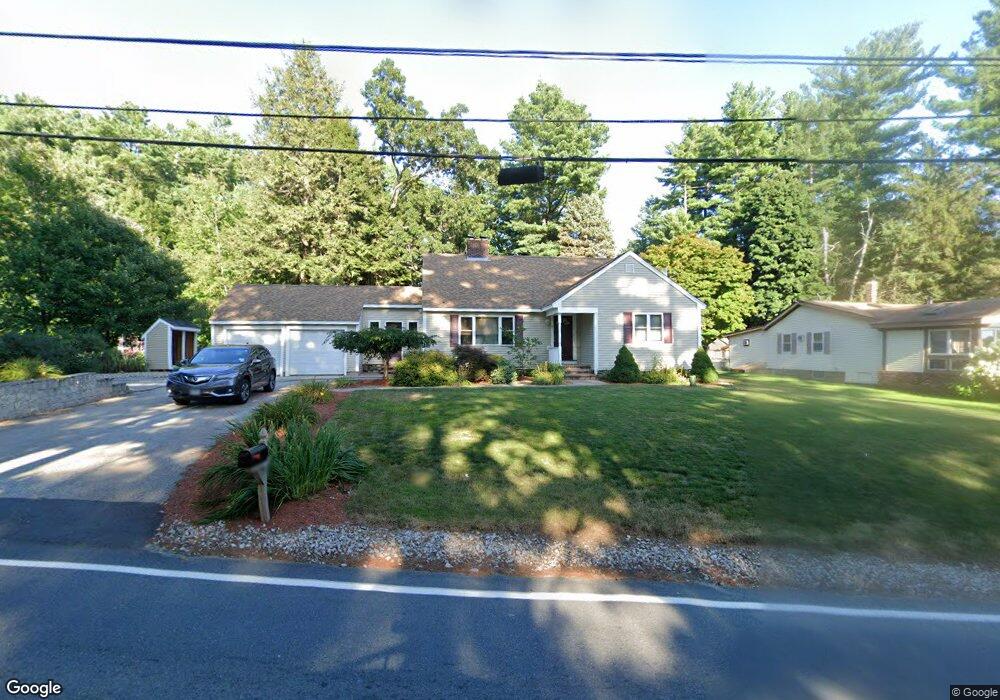
5 N Policy St Windham, NH 03087
Estimated Value: $526,270 - $638,000
3
Beds
2
Baths
1,425
Sq Ft
$396/Sq Ft
Est. Value
About This Home
This home is located at 5 N Policy St, Windham, NH 03087 and is currently estimated at $564,068, approximately $395 per square foot. 5 N Policy St is a home located in Rockingham County with nearby schools including Golden Brook Elementary School, Windham Middle School, and Windham High School.
Ownership History
Date
Name
Owned For
Owner Type
Purchase Details
Closed on
Aug 19, 2016
Sold by
Highfield Craig C
Bought by
Highfield Lt
Current Estimated Value
Purchase Details
Closed on
Sep 18, 2009
Sold by
Robichaud Craig Scot
Bought by
Highfield Craig C
Home Financials for this Owner
Home Financials are based on the most recent Mortgage that was taken out on this home.
Original Mortgage
$180,000
Interest Rate
5.28%
Mortgage Type
Purchase Money Mortgage
Purchase Details
Closed on
Jun 14, 2006
Sold by
5 North Policy Street
Bought by
Robichaud Craig Scot
Home Financials for this Owner
Home Financials are based on the most recent Mortgage that was taken out on this home.
Original Mortgage
$300,000
Interest Rate
6.62%
Mortgage Type
Purchase Money Mortgage
Purchase Details
Closed on
Jan 31, 2000
Sold by
Gurry H William
Bought by
Cunningham Linda L
Create a Home Valuation Report for This Property
The Home Valuation Report is an in-depth analysis detailing your home's value as well as a comparison with similar homes in the area
Home Values in the Area
Average Home Value in this Area
Purchase History
| Date | Buyer | Sale Price | Title Company |
|---|---|---|---|
| Highfield Lt | -- | -- | |
| Highfield Craig C | $225,000 | -- | |
| Robichaud Craig Scot | $300,000 | -- | |
| Cunningham Linda L | $150,000 | -- |
Source: Public Records
Mortgage History
| Date | Status | Borrower | Loan Amount |
|---|---|---|---|
| Previous Owner | Cunningham Linda L | $175,000 | |
| Previous Owner | Cunningham Linda L | $180,000 | |
| Previous Owner | Cunningham Linda L | $300,000 | |
| Previous Owner | Cunningham Linda L | $25,000 |
Source: Public Records
Tax History
| Year | Tax Paid | Tax Assessment Tax Assessment Total Assessment is a certain percentage of the fair market value that is determined by local assessors to be the total taxable value of land and additions on the property. | Land | Improvement |
|---|---|---|---|---|
| 2024 | $7,813 | $345,100 | $149,100 | $196,000 |
| 2023 | $7,385 | $345,100 | $149,100 | $196,000 |
| 2022 | $6,819 | $345,100 | $149,100 | $196,000 |
| 2021 | $6,426 | $345,100 | $149,100 | $196,000 |
| 2020 | $6,602 | $345,100 | $149,100 | $196,000 |
| 2019 | $5,780 | $256,300 | $134,400 | $121,900 |
| 2018 | $5,969 | $256,300 | $134,400 | $121,900 |
| 2017 | $5,177 | $256,300 | $134,400 | $121,900 |
| 2016 | $5,592 | $256,300 | $134,400 | $121,900 |
| 2015 | $5,567 | $256,300 | $134,400 | $121,900 |
| 2014 | $5,640 | $235,000 | $147,000 | $88,000 |
| 2013 | $5,289 | $224,100 | $147,000 | $77,100 |
Source: Public Records
Map
Nearby Homes
Your Personal Tour Guide
Ask me questions while you tour the home.