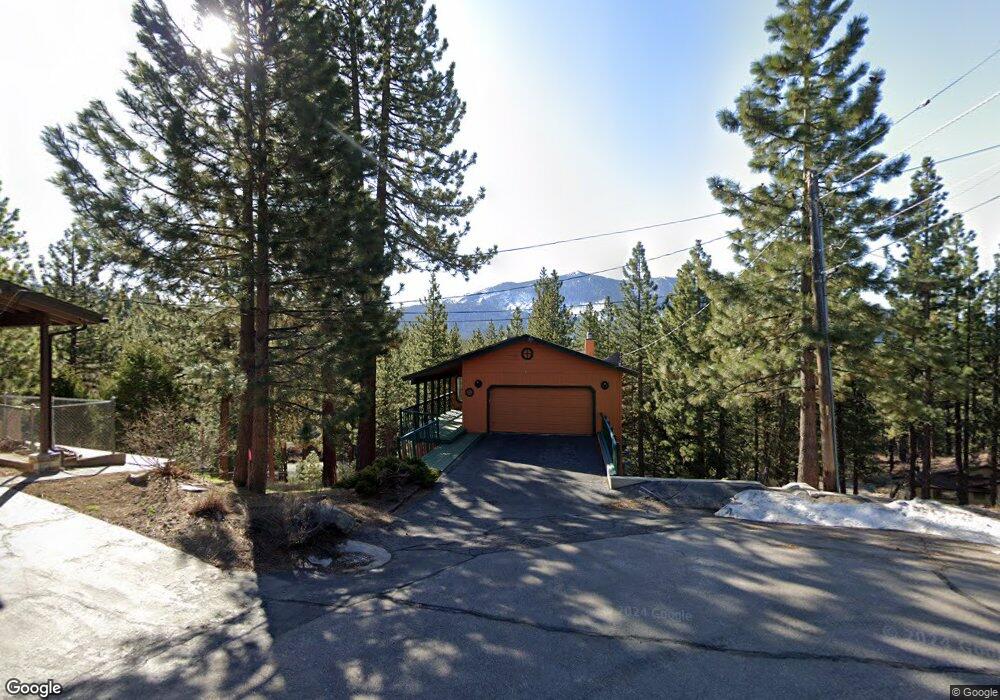
5 Navajo Ct Zephyr Cove, NV 89448
Estimated Value: $1,487,000 - $2,073,000
4
Beds
5
Baths
3,708
Sq Ft
$476/Sq Ft
Est. Value
About This Home
This home is located at 5 Navajo Ct, Zephyr Cove, NV 89448 and is currently estimated at $1,766,101, approximately $476 per square foot. 5 Navajo Ct is a home located in Douglas County with nearby schools including Zephyr Cove Elementary School, George Whittell High School, and Douglas County High School.
Ownership History
Date
Name
Owned For
Owner Type
Purchase Details
Closed on
Feb 19, 2010
Sold by
Gallatin Thomas Lee and Gallatin Sherry Lee
Bought by
Gallatin Thomas Lee and Gallatin Sherry Lee
Current Estimated Value
Purchase Details
Closed on
Mar 12, 2009
Sold by
Page Ventures Llc
Bought by
Gallatin Thomas Lee and Gallatin Sherry Lee
Purchase Details
Closed on
Jan 28, 2009
Sold by
Larson Dale Leslie and Larson Ester Rose
Bought by
National Real Estate Services
Purchase Details
Closed on
Oct 24, 2006
Sold by
The Larson Family Trust and Larson Dale L
Bought by
Larson Dale Leslie and Larson Ester Rose
Home Financials for this Owner
Home Financials are based on the most recent Mortgage that was taken out on this home.
Original Mortgage
$630,000
Interest Rate
7.37%
Mortgage Type
New Conventional
Create a Home Valuation Report for This Property
The Home Valuation Report is an in-depth analysis detailing your home's value as well as a comparison with similar homes in the area
Home Values in the Area
Average Home Value in this Area
Purchase History
| Date | Buyer | Sale Price | Title Company |
|---|---|---|---|
| Gallatin Thomas Lee | -- | None Available | |
| Gallatin Thomas Lee | $545,000 | Northern Nevada Title Co | |
| National Real Estate Services | $425,000 | None Available | |
| Larson Dale Leslie | -- | Stewart Title Of Douglas Cou |
Source: Public Records
Mortgage History
| Date | Status | Borrower | Loan Amount |
|---|---|---|---|
| Previous Owner | Larson Dale Leslie | $630,000 |
Source: Public Records
Tax History Compared to Growth
Tax History
| Year | Tax Paid | Tax Assessment Tax Assessment Total Assessment is a certain percentage of the fair market value that is determined by local assessors to be the total taxable value of land and additions on the property. | Land | Improvement |
|---|---|---|---|---|
| 2025 | $5,446 | $249,703 | $105,000 | $144,703 |
| 2024 | $5,322 | $251,631 | $105,000 | $146,631 |
| 2023 | $5,322 | $241,337 | $105,000 | $136,337 |
| 2022 | $5,126 | $219,704 | $92,750 | $126,954 |
| 2021 | $4,973 | $205,598 | $84,000 | $121,598 |
| 2020 | $4,828 | $202,791 | $84,000 | $118,791 |
| 2019 | $4,689 | $200,715 | $84,000 | $116,715 |
| 2018 | $4,553 | $194,866 | $80,500 | $114,366 |
| 2017 | $4,419 | $185,204 | $70,000 | $115,204 |
| 2016 | $4,310 | $185,796 | $70,000 | $115,796 |
| 2015 | $4,300 | $185,796 | $70,000 | $115,796 |
| 2014 | $4,780 | $178,504 | $70,000 | $108,504 |
Source: Public Records
Map
Nearby Homes
- 450 Mcfaul Way Unit 17
- 259 Mc Faul Ct
- 5 Ute Ct
- 464 Elks Ave
- 458 Center St
- 600 U S 50 Unit 60
- 600 U S 50 Unit 40
- 600 Highway 50 Unit 25
- 600 Highway 50 Unit 43
- 610 Don Dr
- 606 Jerry Dr
- 605 Jerry Dr
- 621 Lakeview Dr
- 670 Riven Rock Rd
- 227 S Martin Dr
- 225 S Martin Dr
- 664 Lookout Rd
- 625 Lake Shore Blvd
- 128 Holly Ln Unit B
- 114 Angora Ct Unit A