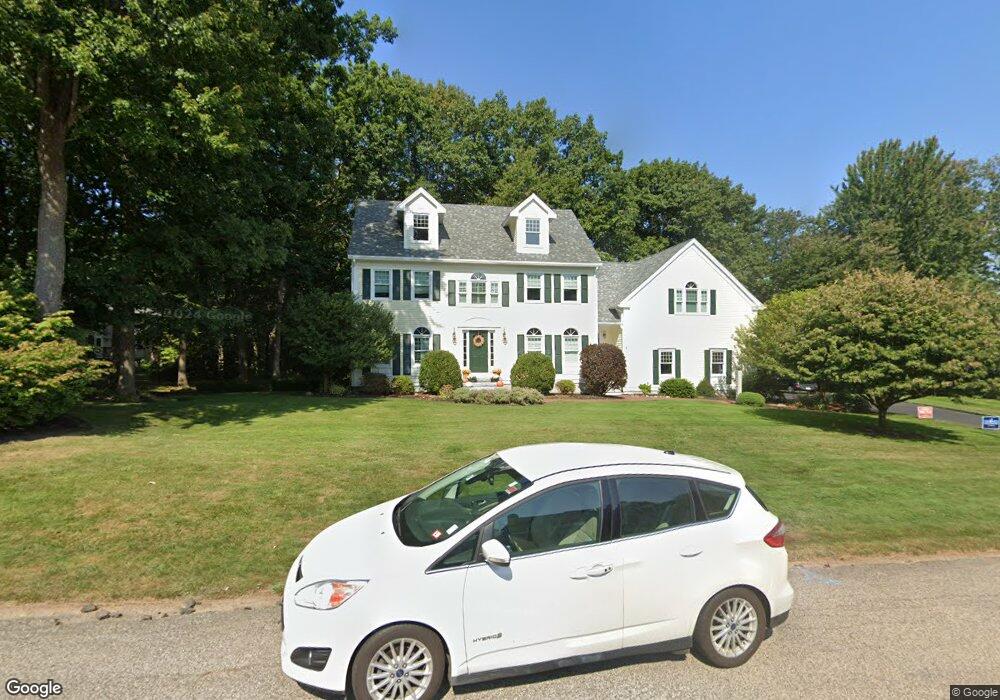
5 Nersesian Way Hampton, NH 03842
Estimated Value: $1,221,000 - $1,538,000
4
Beds
3
Baths
3,472
Sq Ft
$398/Sq Ft
Est. Value
About This Home
This home is located at 5 Nersesian Way, Hampton, NH 03842 and is currently estimated at $1,380,675, approximately $397 per square foot. 5 Nersesian Way is a home located in Rockingham County with nearby schools including Hampton Centre School, Adeline C. Marston Elementary School, and Hampton Academy.
Ownership History
Date
Name
Owned For
Owner Type
Purchase Details
Closed on
Jul 18, 1997
Sold by
Green & Co Bldg & Dev
Bought by
Muns A Christian and Muns Melanie T
Current Estimated Value
Home Financials for this Owner
Home Financials are based on the most recent Mortgage that was taken out on this home.
Original Mortgage
$200,000
Outstanding Balance
$24,361
Interest Rate
7.79%
Estimated Equity
$1,356,314
Create a Home Valuation Report for This Property
The Home Valuation Report is an in-depth analysis detailing your home's value as well as a comparison with similar homes in the area
Home Values in the Area
Average Home Value in this Area
Purchase History
| Date | Buyer | Sale Price | Title Company |
|---|---|---|---|
| Muns A Christian | $390,000 | -- | |
| Green & Co Bldg & Dev | $85,000 | -- |
Source: Public Records
Mortgage History
| Date | Status | Borrower | Loan Amount |
|---|---|---|---|
| Open | Green & Co Bldg & Dev | $38,000 | |
| Open | Green & Co Bldg & Dev | $200,000 |
Source: Public Records
Tax History
| Year | Tax Paid | Tax Assessment Tax Assessment Total Assessment is a certain percentage of the fair market value that is determined by local assessors to be the total taxable value of land and additions on the property. | Land | Improvement |
|---|---|---|---|---|
| 2025 | $14,483 | $1,175,600 | $547,100 | $628,500 |
| 2024 | $14,483 | $1,175,600 | $547,100 | $628,500 |
| 2023 | $12,824 | $765,600 | $314,700 | $450,900 |
| 2022 | $12,127 | $765,600 | $314,700 | $450,900 |
| 2021 | $12,127 | $765,600 | $314,700 | $450,900 |
| 2020 | $12,010 | $753,900 | $314,700 | $439,200 |
| 2019 | $12,070 | $753,900 | $314,700 | $439,200 |
| 2018 | $11,999 | $705,000 | $286,400 | $418,600 |
| 2017 | $11,541 | $705,000 | $286,400 | $418,600 |
| 2016 | $11,336 | $705,000 | $286,400 | $418,600 |
| 2015 | $10,567 | $551,500 | $225,500 | $326,000 |
| 2014 | $10,124 | $552,900 | $225,500 | $327,400 |
Source: Public Records
Map
Nearby Homes
- 61 Acorn Rd
- 43 Ancient Hwy
- 30 Ancient Hwy
- 943 Ocean Blvd Unit 21
- 939 Ocean Blvd Unit 14
- 12 Runnymede Dr
- 190 Kings Hwy Unit A1
- 467 High St Unit 10
- 415 High St Unit 3
- 7 Redman St
- 11 Redman St
- 745 Ocean Blvd
- 29 Thorwald Ave
- 550 Winnacunnet Rd Unit 218
- 38 Mill Rd
- 2 Hilliard Dr
- 3 Playhouse Cir
- 20 Causeway Rd
- 11 Lamson Ln
- 567 Ocean Blvd Unit 104
Your Personal Tour Guide
Ask me questions while you tour the home.