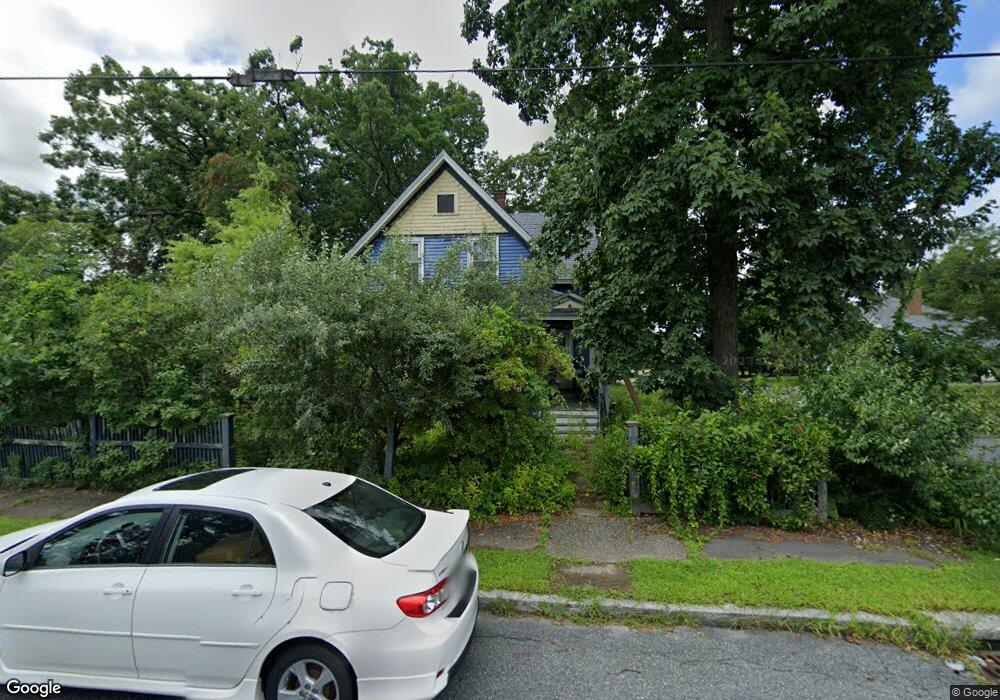
5 Paul St Worcester, MA 01606
Greendale NeighborhoodEstimated Value: $356,000 - $414,000
2
Beds
2
Baths
1,365
Sq Ft
$286/Sq Ft
Est. Value
About This Home
This home is located at 5 Paul St, Worcester, MA 01606 and is currently estimated at $390,032, approximately $285 per square foot. 5 Paul St is a home located in Worcester County with nearby schools including Jacob Hiatt Magnet School, Chandler Magnet, and Thorndyke Road School.
Ownership History
Date
Name
Owned For
Owner Type
Purchase Details
Closed on
Jul 7, 2017
Sold by
Cagnon John E and Holland-Cagnon Diane L
Bought by
Holland Diane L and Gilberg John C
Current Estimated Value
Purchase Details
Closed on
Apr 11, 1995
Sold by
Est Adamson Ruth and Adamson Robert
Bought by
Cagnon John E and Cagnon Diane
Home Financials for this Owner
Home Financials are based on the most recent Mortgage that was taken out on this home.
Original Mortgage
$68,507
Interest Rate
8.66%
Mortgage Type
Purchase Money Mortgage
Create a Home Valuation Report for This Property
The Home Valuation Report is an in-depth analysis detailing your home's value as well as a comparison with similar homes in the area
Home Values in the Area
Average Home Value in this Area
Purchase History
| Date | Buyer | Sale Price | Title Company |
|---|---|---|---|
| Holland Diane L | -- | -- | |
| Cagnon John E | $70,000 | -- |
Source: Public Records
Mortgage History
| Date | Status | Borrower | Loan Amount |
|---|---|---|---|
| Previous Owner | Cagnon John E | $67,555 | |
| Previous Owner | Cagnon John E | $68,507 |
Source: Public Records
Tax History Compared to Growth
Tax History
| Year | Tax Paid | Tax Assessment Tax Assessment Total Assessment is a certain percentage of the fair market value that is determined by local assessors to be the total taxable value of land and additions on the property. | Land | Improvement |
|---|---|---|---|---|
| 2025 | $4,297 | $325,800 | $115,700 | $210,100 |
| 2024 | $4,144 | $301,400 | $115,700 | $185,700 |
| 2023 | $3,964 | $276,400 | $100,600 | $175,800 |
| 2022 | $3,628 | $238,500 | $80,500 | $158,000 |
| 2021 | $3,477 | $213,600 | $64,400 | $149,200 |
| 2020 | $3,332 | $196,000 | $64,400 | $131,600 |
| 2019 | $3,199 | $177,700 | $57,900 | $119,800 |
| 2018 | $3,203 | $169,400 | $57,900 | $111,500 |
| 2017 | $3,081 | $160,300 | $57,900 | $102,400 |
| 2016 | $3,003 | $145,700 | $42,400 | $103,300 |
| 2015 | $2,924 | $145,700 | $42,400 | $103,300 |
| 2014 | $2,847 | $145,700 | $42,400 | $103,300 |
Source: Public Records
Map
Nearby Homes
- 43 Fales St
- 314 Burncoat St
- 40 Francis St
- 14 Fales St
- 15 Inwood Rd
- 18 Claffey Ave
- 80 Clark St
- 3 Granville Ave
- 68 Housatonic St
- 14 Housatonic St
- 134 Whitmarsh Ave
- 29 E Mountain
- 95 Saint Nicholas Ave
- 28 Brooks St
- 12 Prudential Rd
- 49 Prudential Rd
- 34 King Philip Rd
- 113 Bay State Rd
- 126 Brooks St
- 80 Prudential Rd