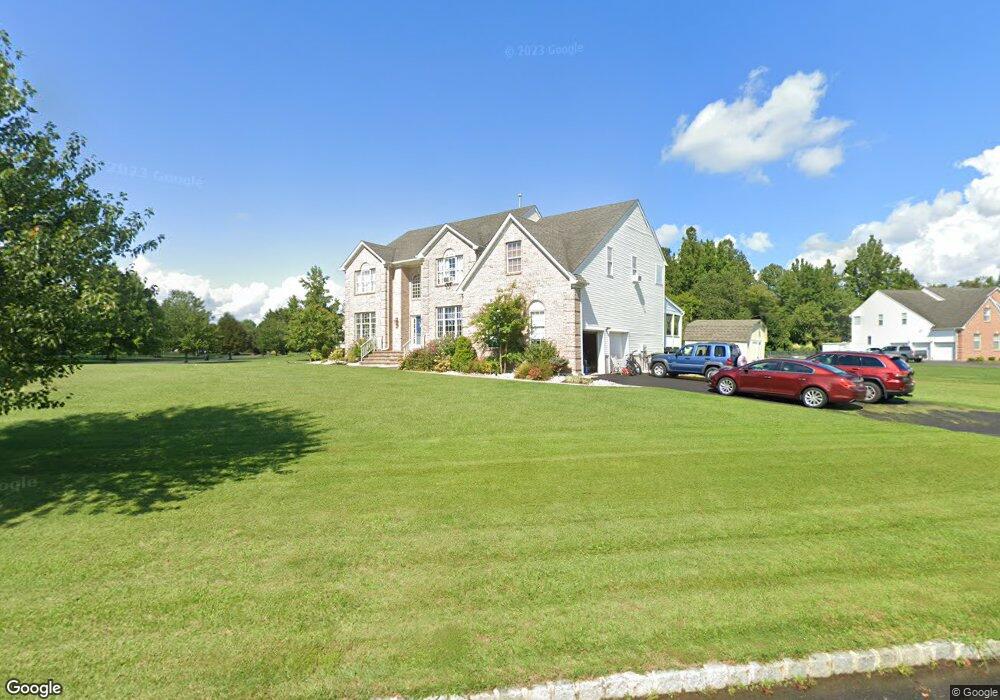
5 Philip Ct Allentown, NJ 08501
Estimated Value: $947,000 - $1,068,298
4
Beds
2
Baths
3,408
Sq Ft
$296/Sq Ft
Est. Value
About This Home
This home is located at 5 Philip Ct, Allentown, NJ 08501 and is currently estimated at $1,009,825, approximately $296 per square foot. 5 Philip Ct is a home located in Monmouth County with nearby schools including Newell Elementary School, Stonebridge Middle School, and Allentown High School.
Ownership History
Date
Name
Owned For
Owner Type
Purchase Details
Closed on
Dec 28, 2000
Sold by
Showcase Homes
Bought by
Kelton Steven and Kelton Lauren
Current Estimated Value
Home Financials for this Owner
Home Financials are based on the most recent Mortgage that was taken out on this home.
Original Mortgage
$230,000
Outstanding Balance
$84,739
Interest Rate
7.52%
Estimated Equity
$925,086
Create a Home Valuation Report for This Property
The Home Valuation Report is an in-depth analysis detailing your home's value as well as a comparison with similar homes in the area
Home Values in the Area
Average Home Value in this Area
Purchase History
| Date | Buyer | Sale Price | Title Company |
|---|---|---|---|
| Kelton Steven | $362,715 | -- |
Source: Public Records
Mortgage History
| Date | Status | Borrower | Loan Amount |
|---|---|---|---|
| Open | Kelton Steven | $230,000 |
Source: Public Records
Tax History Compared to Growth
Tax History
| Year | Tax Paid | Tax Assessment Tax Assessment Total Assessment is a certain percentage of the fair market value that is determined by local assessors to be the total taxable value of land and additions on the property. | Land | Improvement |
|---|---|---|---|---|
| 2025 | $16,293 | $905,900 | $235,500 | $670,400 |
| 2024 | $17,395 | $755,700 | $129,700 | $626,000 |
| 2023 | $17,395 | $783,200 | $110,200 | $673,000 |
| 2022 | $15,091 | $680,800 | $148,200 | $532,600 |
| 2021 | $15,091 | $622,300 | $145,900 | $476,400 |
| 2020 | $14,827 | $614,200 | $145,900 | $468,300 |
| 2019 | $14,708 | $613,600 | $145,400 | $468,200 |
| 2018 | $14,515 | $596,600 | $145,400 | $451,200 |
| 2017 | $14,293 | $595,300 | $145,400 | $449,900 |
| 2016 | $14,177 | $597,700 | $154,300 | $443,400 |
| 2015 | $13,441 | $572,700 | $144,800 | $427,900 |
| 2014 | $12,830 | $550,900 | $144,800 | $406,100 |
Source: Public Records
Map
Nearby Homes
- 11 Probasco Dr
- 34 N Main St
- 22 Route 524
- 30 Ridgeview Way
- 8 Coates Rd
- 35 Church St
- 151 Walnford Rd
- 467 Gordon Rd
- 33 Bunker Hill Dr
- 10 Powderhorn Way
- 16 Powderhorn Way
- 40 Bunker Hill Dr
- 81 Potts Rd
- 79 Potts Rd
- 6 Meetinghouse Rd
- 8 Meetinghouse Rd
- 10 Meetinghouse Rd
- 163 Sharon Station Rd
- 296 Extonville Rd
- 3 Dartmouth Ct