5 S Shore Dr Orange, MA 01364
Estimated Value: $283,990 - $370,000
About This Home
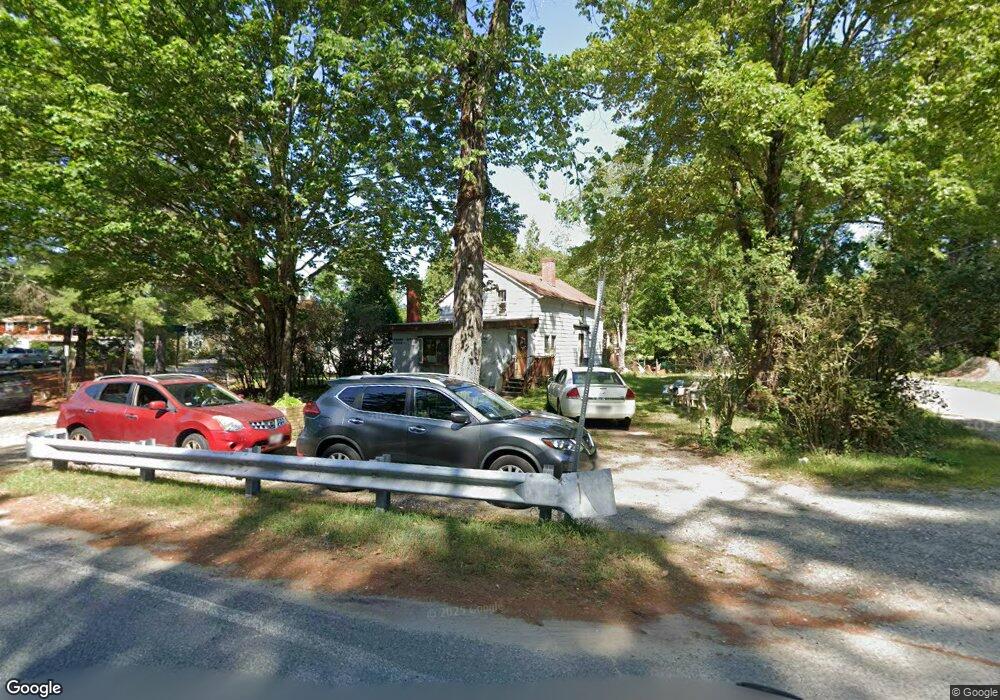
This home is located at 5 S Shore Dr, Orange, MA 01364 and is currently estimated at $325,998, approximately $252 per square foot. 5 S Shore Dr is a home located in Franklin County with nearby schools including Fisher Hill and Ralph C Mahar Regional School.
Ownership History
We collect this data history from publicly available records. To have your information removed, we recommend requesting removal directly through your county’s website.
Purchase Details
Home Financials for this Owner
Home Financials are based on the most recent Mortgage that was taken out on this home.Purchase Details
Home Values in the Area
Average Home Value in this Area
Purchase History
We collect this data history from publicly available records. To have your information removed, we recommend requesting removal directly through your county’s website.
| Date | Buyer | Sale Price | Title Company |
|---|---|---|---|
| $35,000 | -- | ||
| $42,000 | -- |
Mortgage History
We collect this data history from publicly available records. To have your information removed, we recommend requesting removal directly through your county’s website.
| Date | Status | Borrower | Loan Amount |
|---|---|---|---|
| Open | $50,000 | ||
| Closed | $28,000 | ||
| Previous Owner | $9,700 |
Tax History
We collect this data history from publicly available records. To have your information removed, we recommend requesting removal directly through your county’s website.
| Year | Tax Paid | Tax Assessment Tax Assessment Total Assessment is a certain percentage of the fair market value that is determined by local assessors to be the total taxable value of land and additions on the property. | Land | Improvement |
|---|---|---|---|---|
| 2025 | $40 | $245,600 | $43,500 | $202,100 |
| 2024 | $3,837 | $220,000 | $43,500 | $176,500 |
| 2023 | $3,412 | $190,000 | $40,800 | $149,200 |
| 2022 | $2,746 | $143,600 | $23,900 | $119,700 |
| 2021 | $2,789 | $139,100 | $47,300 | $91,800 |
| 2020 | $44 | $131,500 | $44,000 | $87,500 |
| 2019 | $2,660 | $118,100 | $39,300 | $78,800 |
| 2018 | $44 | $110,400 | $38,200 | $72,200 |
| 2017 | $47 | $110,400 | $38,200 | $72,200 |
| 2016 | $2,324 | $107,100 | $40,000 | $67,100 |
| 2015 | $2,152 | $103,600 | $36,300 | $67,300 |
| 2014 | $2,142 | $108,500 | $34,500 | $74,000 |
Map
- 0 Camp Rd
- 31 Camp Rd
- 246 Holtshire Rd Unit Lot 3
- 610 S Main St
- 244 Holtshire Rd Unit Lot 4
- 15 Johnson Rd
- 0 S Main St
- 00 S Main St
- 000 S Main St
- 0 Quabbin Blvd
- 2 Fay Rd
- 277 Walnut Hill Rd
- 276 Pleasant St
- 30 Stone Valley Rd
- 0 Walnut Hill Rd Unit 73517214
- 29 W Main St
- 12-14 E Main St
- 83 W Main St
- 50 E Main St
- 166-168 W Main St
- 383 Holtshire Rd
- 376 Holtshire Rd
- 64 S Shore Dr
- 371 Holtshire Rd
- 15 Beach Ln
- 59 S Shore Dr
- 59 S Shore Dr Unit 1
- 378 Holtshire Rd
- 21 Beach Ln
- 57 S Shore Dr
- 382 Holtshire Rd
- 63 S Shore Dr
- 69 S Shore Dr
- 75 S Shore Dr
- 362 Holtshire Rd
- 387 Holtshire Rd
- 390 Holtshire Rd
- 83 S Shore Dr
- 76 S Shore Dr
- 360 Holtshire Rd
Ask me questions while you tour the home.