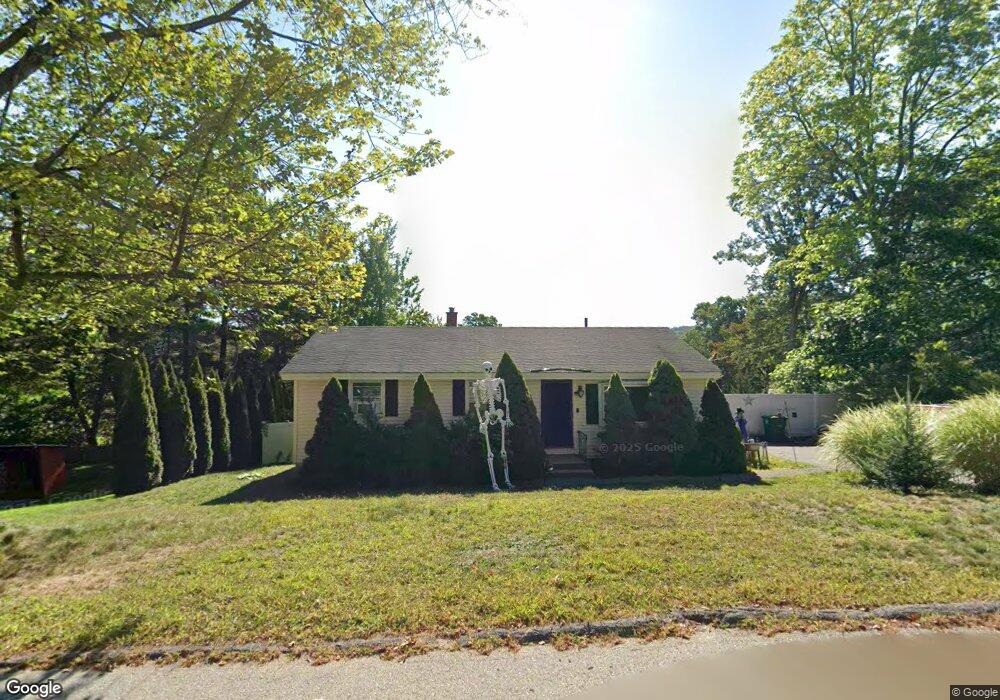
5 Shelton St Nashua, NH 03062
Southwest Nashua NeighborhoodEstimated Value: $448,000 - $485,000
3
Beds
1
Bath
1,440
Sq Ft
$325/Sq Ft
Est. Value
About This Home
This home is located at 5 Shelton St, Nashua, NH 03062 and is currently estimated at $468,270, approximately $325 per square foot. 5 Shelton St is a home located in Hillsborough County with nearby schools including New Searles School, Fairgrounds Middle School, and Nashua High School South.
Ownership History
Date
Name
Owned For
Owner Type
Purchase Details
Closed on
Nov 30, 2009
Sold by
Smith Matthew J
Bought by
Ryan Michael and Ryan Joanne
Current Estimated Value
Home Financials for this Owner
Home Financials are based on the most recent Mortgage that was taken out on this home.
Original Mortgage
$199,212
Outstanding Balance
$130,595
Interest Rate
4.92%
Mortgage Type
Purchase Money Mortgage
Estimated Equity
$332,354
Purchase Details
Closed on
Nov 19, 2008
Sold by
Gmac Mortgage Llc
Bought by
Smith Matthew J
Home Financials for this Owner
Home Financials are based on the most recent Mortgage that was taken out on this home.
Original Mortgage
$166,798
Interest Rate
6.03%
Mortgage Type
Purchase Money Mortgage
Purchase Details
Closed on
Oct 23, 2008
Sold by
Quinlan James P
Bought by
Gmac Mortgage Llc
Home Financials for this Owner
Home Financials are based on the most recent Mortgage that was taken out on this home.
Original Mortgage
$166,798
Interest Rate
6.03%
Mortgage Type
Purchase Money Mortgage
Purchase Details
Closed on
Jun 16, 2006
Sold by
Rootovich David J and Rootovich Eman
Bought by
Quinlan James P and Quinlan Lia
Create a Home Valuation Report for This Property
The Home Valuation Report is an in-depth analysis detailing your home's value as well as a comparison with similar homes in the area
Home Values in the Area
Average Home Value in this Area
Purchase History
| Date | Buyer | Sale Price | Title Company |
|---|---|---|---|
| Ryan Michael | $202,900 | -- | |
| Smith Matthew J | $169,000 | -- | |
| Gmac Mortgage Llc | $170,000 | -- | |
| Quinlan James P | $258,000 | -- |
Source: Public Records
Mortgage History
| Date | Status | Borrower | Loan Amount |
|---|---|---|---|
| Open | Quinlan James P | $199,212 | |
| Previous Owner | Quinlan James P | $169,299 | |
| Previous Owner | Quinlan James P | $166,798 | |
| Previous Owner | Quinlan James P | $15,931 |
Source: Public Records
Tax History Compared to Growth
Tax History
| Year | Tax Paid | Tax Assessment Tax Assessment Total Assessment is a certain percentage of the fair market value that is determined by local assessors to be the total taxable value of land and additions on the property. | Land | Improvement |
|---|---|---|---|---|
| 2023 | $6,111 | $335,200 | $121,900 | $213,300 |
| 2022 | $6,057 | $335,200 | $121,900 | $213,300 |
| 2021 | $5,401 | $232,600 | $81,300 | $151,300 |
| 2020 | $5,259 | $232,600 | $81,300 | $151,300 |
| 2019 | $5,061 | $232,600 | $81,300 | $151,300 |
| 2018 | $4,933 | $232,600 | $81,300 | $151,300 |
| 2017 | $4,472 | $173,400 | $63,200 | $110,200 |
| 2016 | $4,347 | $173,400 | $63,200 | $110,200 |
| 2015 | $4,254 | $173,400 | $63,200 | $110,200 |
| 2014 | $4,170 | $173,400 | $63,200 | $110,200 |
Source: Public Records
Map
Nearby Homes