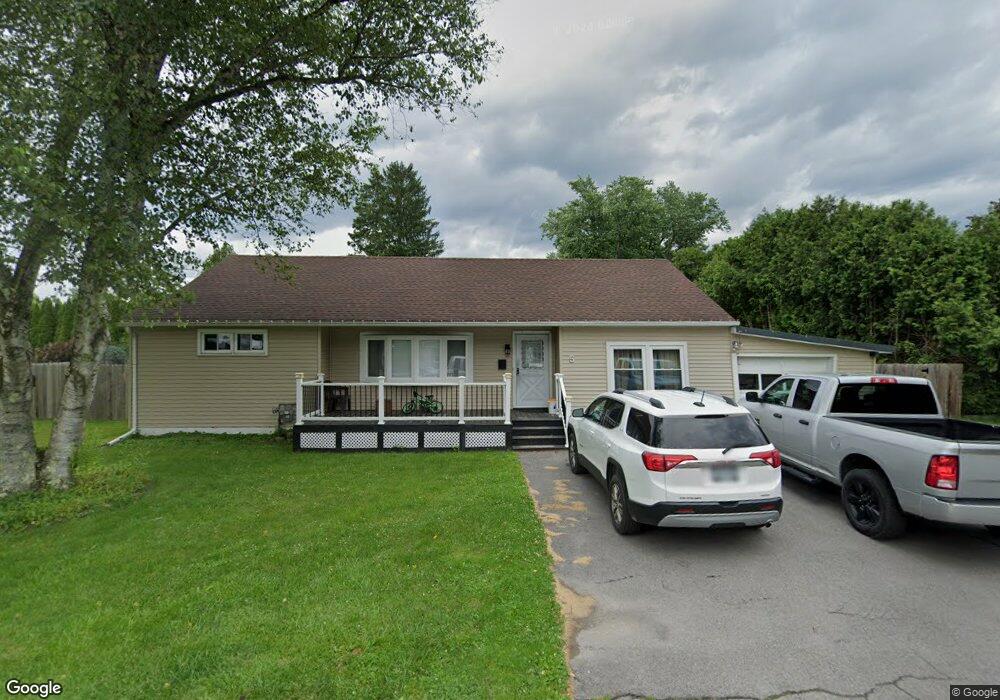
5 Spring St Mohawk, NY 13407
Estimated Value: $136,000 - $194,850
3
Beds
2
Baths
1,062
Sq Ft
$161/Sq Ft
Est. Value
About This Home
This home is located at 5 Spring St, Mohawk, NY 13407 and is currently estimated at $170,963, approximately $160 per square foot. 5 Spring St is a home located in Herkimer County with nearby schools including Harry M. Fisher Elementary School, Barringer Road Elementary School, and Gregory B. Jarvis Middle School.
Ownership History
Date
Name
Owned For
Owner Type
Purchase Details
Closed on
Oct 31, 2007
Sold by
Santillo Michael R
Bought by
Honaker David
Current Estimated Value
Home Financials for this Owner
Home Financials are based on the most recent Mortgage that was taken out on this home.
Original Mortgage
$120,000
Outstanding Balance
$76,121
Interest Rate
6.43%
Mortgage Type
Purchase Money Mortgage
Estimated Equity
$94,842
Purchase Details
Closed on
Dec 14, 1995
Sold by
Babcock Wanda
Bought by
Santillo Michael R
Create a Home Valuation Report for This Property
The Home Valuation Report is an in-depth analysis detailing your home's value as well as a comparison with similar homes in the area
Home Values in the Area
Average Home Value in this Area
Purchase History
| Date | Buyer | Sale Price | Title Company |
|---|---|---|---|
| Honaker David | $120,000 | -- | |
| Santillo Michael R | $83,000 | -- |
Source: Public Records
Mortgage History
| Date | Status | Borrower | Loan Amount |
|---|---|---|---|
| Open | Honaker David | $120,000 | |
| Closed | Honaker David | $166,400 |
Source: Public Records
Tax History
| Year | Tax Paid | Tax Assessment Tax Assessment Total Assessment is a certain percentage of the fair market value that is determined by local assessors to be the total taxable value of land and additions on the property. | Land | Improvement |
|---|---|---|---|---|
| 2024 | $4,423 | $73,400 | $11,500 | $61,900 |
| 2023 | $4,430 | $73,400 | $11,500 | $61,900 |
| 2022 | $4,303 | $73,400 | $11,500 | $61,900 |
| 2021 | $4,222 | $73,400 | $11,500 | $61,900 |
| 2020 | $3,451 | $71,500 | $11,500 | $60,000 |
| 2019 | $1,862 | $71,500 | $11,500 | $60,000 |
| 2018 | $3,385 | $71,500 | $11,500 | $60,000 |
| 2017 | $3,285 | $71,500 | $11,500 | $60,000 |
| 2016 | $3,173 | $71,500 | $11,500 | $60,000 |
| 2015 | -- | $71,500 | $11,500 | $60,000 |
| 2014 | -- | $71,500 | $11,500 | $60,000 |
Source: Public Records
Map
Nearby Homes
Your Personal Tour Guide
Ask me questions while you tour the home.