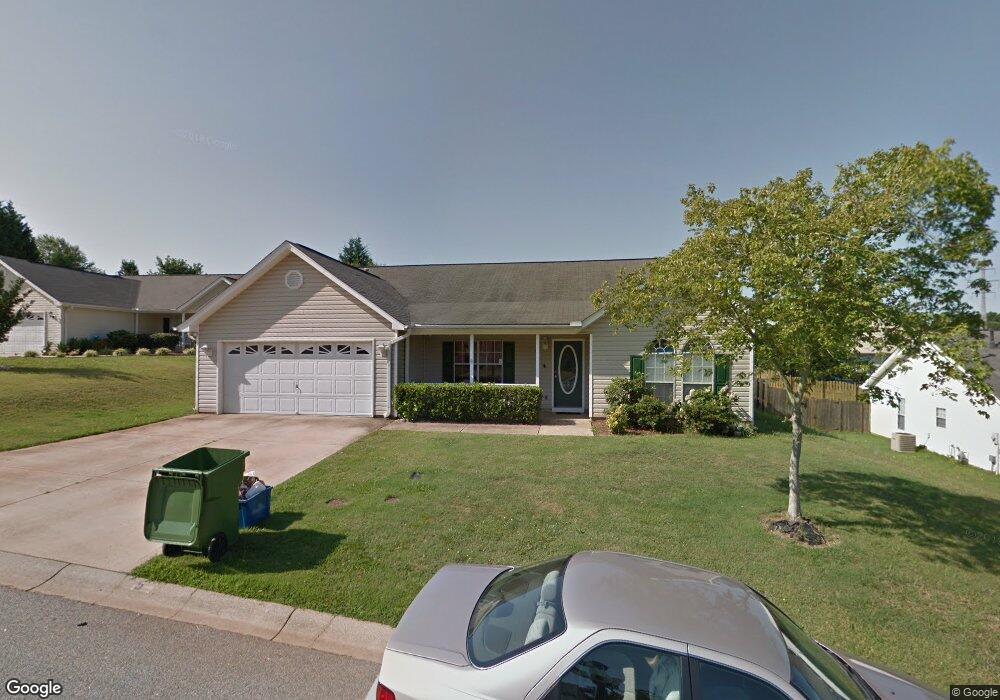
5 Stetson Ct Mauldin, SC 29662
Estimated Value: $299,000 - $349,000
3
Beds
2
Baths
1,943
Sq Ft
$163/Sq Ft
Est. Value
About This Home
This home is located at 5 Stetson Ct, Mauldin, SC 29662 and is currently estimated at $315,838, approximately $162 per square foot. 5 Stetson Ct is a home located in Greenville County with nearby schools including Bethel Elementary School, Mauldin Middle School, and Mauldin High School.
Ownership History
Date
Name
Owned For
Owner Type
Purchase Details
Closed on
Feb 15, 2023
Sold by
Smith Dawn
Bought by
Kozie Jordan
Current Estimated Value
Home Financials for this Owner
Home Financials are based on the most recent Mortgage that was taken out on this home.
Original Mortgage
$192,500
Outstanding Balance
$185,366
Interest Rate
6.48%
Mortgage Type
New Conventional
Estimated Equity
$130,472
Purchase Details
Closed on
Sep 3, 2015
Sold by
Le Minh Hang Thi
Bought by
Smith Dawn R
Home Financials for this Owner
Home Financials are based on the most recent Mortgage that was taken out on this home.
Original Mortgage
$116,000
Interest Rate
4.09%
Mortgage Type
New Conventional
Purchase Details
Closed on
Mar 14, 2008
Sold by
Mcclelland Katie
Bought by
Le Minh Hang Thi
Home Financials for this Owner
Home Financials are based on the most recent Mortgage that was taken out on this home.
Original Mortgage
$127,800
Interest Rate
5.62%
Mortgage Type
Purchase Money Mortgage
Purchase Details
Closed on
Jan 4, 2007
Sold by
Sigmon Richard W and Sigmon Gina K
Bought by
Mcclelland Katie
Home Financials for this Owner
Home Financials are based on the most recent Mortgage that was taken out on this home.
Original Mortgage
$113,700
Interest Rate
6.75%
Mortgage Type
New Conventional
Create a Home Valuation Report for This Property
The Home Valuation Report is an in-depth analysis detailing your home's value as well as a comparison with similar homes in the area
Home Values in the Area
Average Home Value in this Area
Purchase History
| Date | Buyer | Sale Price | Title Company |
|---|---|---|---|
| Kozie Jordan | $275,000 | South Carolina Title | |
| Smith Dawn R | $145,000 | -- | |
| Le Minh Hang Thi | $142,000 | Attorney | |
| Mcclelland Katie | $142,140 | None Available |
Source: Public Records
Mortgage History
| Date | Status | Borrower | Loan Amount |
|---|---|---|---|
| Open | Kozie Jordan | $192,500 | |
| Previous Owner | Smith Dawn R | $116,000 | |
| Previous Owner | Le Minh Hang Thi | $127,800 | |
| Previous Owner | Mcclelland Katie | $113,700 |
Source: Public Records
Tax History
| Year | Tax Paid | Tax Assessment Tax Assessment Total Assessment is a certain percentage of the fair market value that is determined by local assessors to be the total taxable value of land and additions on the property. | Land | Improvement |
|---|---|---|---|---|
| 2025 | $1,936 | $11,750 | $2,200 | $9,550 |
| 2024 | $1,936 | $10,410 | $2,000 | $8,410 |
| 2023 | $1,890 | $6,310 | $870 | $5,440 |
| 2022 | $1,089 | $6,310 | $870 | $5,440 |
| 2021 | $1,090 | $6,310 | $870 | $5,440 |
| 2020 | $1,007 | $5,490 | $760 | $4,730 |
| 2019 | $1,008 | $5,490 | $760 | $4,730 |
| 2018 | $1,006 | $5,490 | $760 | $4,730 |
| 2017 | $1,006 | $5,490 | $760 | $4,730 |
| 2016 | $966 | $137,370 | $19,000 | $118,370 |
| 2015 | $966 | $137,370 | $19,000 | $118,370 |
| 2014 | $1,005 | $144,030 | $19,000 | $125,030 |
Source: Public Records
Map
Nearby Homes
- 106 Archdale Dr
- 123 Bangor St
- 418 Erbosco Dr
- 4 Connaught Ct
- 100 Fernande Dr
- 61 Connaught Ct
- 305 Wild Rice Dr
- 702 Central Ave
- 309 Tradd St
- 116 Nobska Light Ct
- 224 Hadley Commons Dr
- 245 Hadley Commons Dr
- 312 Mimosa Dr
- 1308 Alexandrite Ln
- 227 E Butler Rd
- 108 Parkland Dr
- 401 Central Ave
- 303 Pemaquid Ct
- 311 Birchwood Ln
- 448 Canewood Place
Your Personal Tour Guide
Ask me questions while you tour the home.