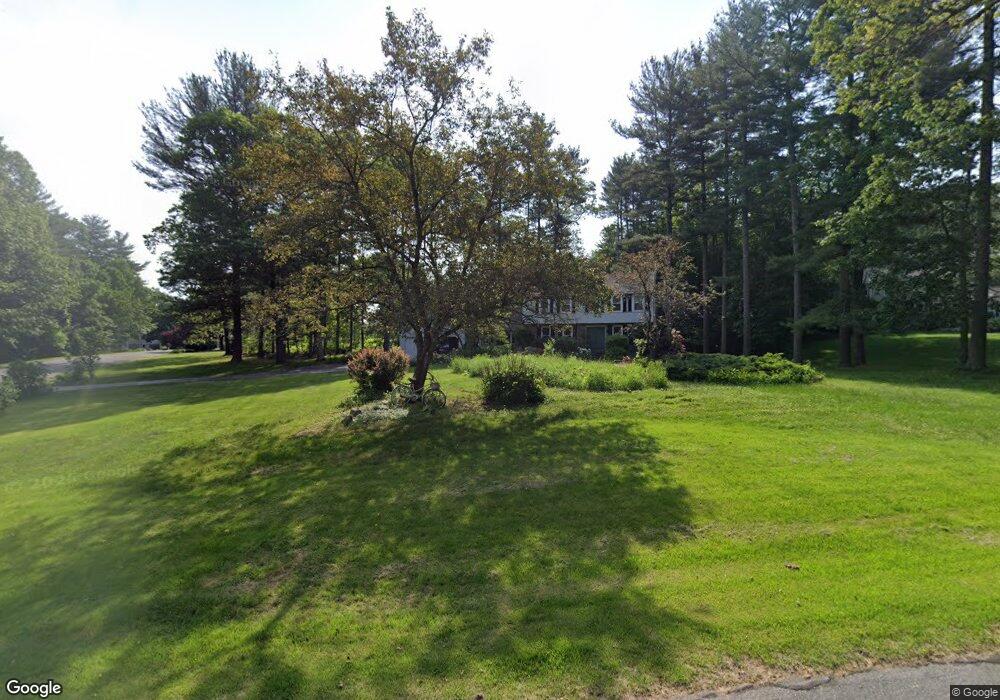
5 Sutton Place Londonderry, NH 03053
Estimated Value: $642,000 - $709,000
4
Beds
3
Baths
2,260
Sq Ft
$301/Sq Ft
Est. Value
About This Home
This home is located at 5 Sutton Place, Londonderry, NH 03053 and is currently estimated at $679,142, approximately $300 per square foot. 5 Sutton Place is a home with nearby schools including Londonderry Middle School, Londonderry Senior High School, and Tabernacle Christian School.
Ownership History
Date
Name
Owned For
Owner Type
Purchase Details
Closed on
Oct 30, 2000
Sold by
Brennman Karonne K
Bought by
Brennman A Derald
Current Estimated Value
Purchase Details
Closed on
Nov 3, 1997
Sold by
Littleton M Machan and Littleton Kathryn E
Bought by
Brennman Karonne K
Home Financials for this Owner
Home Financials are based on the most recent Mortgage that was taken out on this home.
Original Mortgage
$167,250
Interest Rate
7.31%
Purchase Details
Closed on
Apr 15, 1996
Sold by
Bartini David M and Bartini Jennifer W
Bought by
Littleton M Machan and Littleton Kathryn E
Create a Home Valuation Report for This Property
The Home Valuation Report is an in-depth analysis detailing your home's value as well as a comparison with similar homes in the area
Home Values in the Area
Average Home Value in this Area
Purchase History
| Date | Buyer | Sale Price | Title Company |
|---|---|---|---|
| Brennman A Derald | $85,100 | -- | |
| Brennman Karonne K | $176,100 | -- | |
| Littleton M Machan | $165,900 | -- |
Source: Public Records
Mortgage History
| Date | Status | Borrower | Loan Amount |
|---|---|---|---|
| Open | Littleton M Machan | $228,500 | |
| Closed | Littleton M Machan | $241,147 | |
| Closed | Littleton M Machan | $30,000 | |
| Previous Owner | Littleton M Machan | $167,250 |
Source: Public Records
Tax History Compared to Growth
Tax History
| Year | Tax Paid | Tax Assessment Tax Assessment Total Assessment is a certain percentage of the fair market value that is determined by local assessors to be the total taxable value of land and additions on the property. | Land | Improvement |
|---|---|---|---|---|
| 2024 | $9,271 | $574,400 | $219,900 | $354,500 |
| 2023 | $8,989 | $574,400 | $219,900 | $354,500 |
| 2022 | $8,327 | $450,600 | $164,800 | $285,800 |
| 2021 | $8,282 | $450,600 | $164,800 | $285,800 |
| 2020 | $8,412 | $418,300 | $134,200 | $284,100 |
| 2019 | $8,111 | $418,300 | $134,200 | $284,100 |
| 2018 | $7,416 | $340,200 | $111,100 | $229,100 |
| 2017 | $7,352 | $340,200 | $111,100 | $229,100 |
| 2016 | $7,314 | $340,200 | $111,100 | $229,100 |
| 2015 | $7,151 | $340,200 | $111,100 | $229,100 |
| 2014 | $7,175 | $340,200 | $111,100 | $229,100 |
| 2011 | -- | $346,300 | $111,100 | $235,200 |
Source: Public Records
Map
Nearby Homes