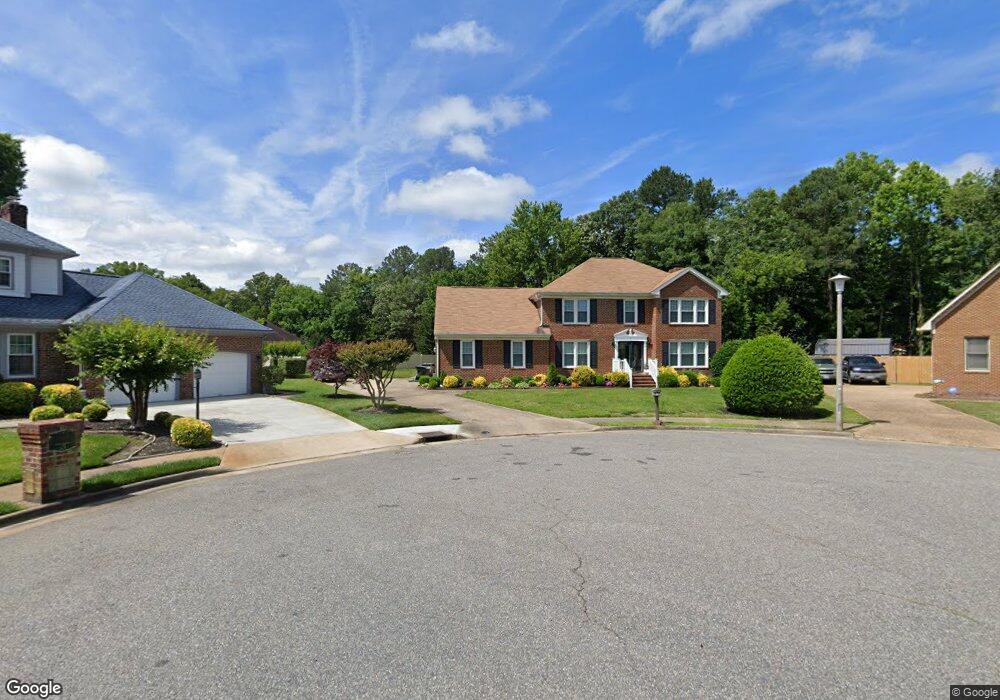
5 W Creek Ct Hampton, VA 23666
Northampton NeighborhoodEstimated Value: $473,981 - $537,000
4
Beds
3
Baths
2,900
Sq Ft
$174/Sq Ft
Est. Value
About This Home
This home is located at 5 W Creek Ct, Hampton, VA 23666 and is currently estimated at $503,995, approximately $173 per square foot. 5 W Creek Ct is a home located in Hampton City with nearby schools including George P. Phenix Elementary School, Cesar Tarrant Middle School, and Bethel High School.
Ownership History
Date
Name
Owned For
Owner Type
Purchase Details
Closed on
May 21, 2019
Sold by
Warren Josephine C
Bought by
Chowdhury Mohammed Alauddin and Akter Shaheen
Current Estimated Value
Home Financials for this Owner
Home Financials are based on the most recent Mortgage that was taken out on this home.
Original Mortgage
$271,800
Outstanding Balance
$238,482
Interest Rate
4.1%
Mortgage Type
Purchase Money Mortgage
Estimated Equity
$265,513
Create a Home Valuation Report for This Property
The Home Valuation Report is an in-depth analysis detailing your home's value as well as a comparison with similar homes in the area
Home Values in the Area
Average Home Value in this Area
Purchase History
| Date | Buyer | Sale Price | Title Company |
|---|---|---|---|
| Chowdhury Mohammed Alauddin | $302,000 | Bay Title Llc |
Source: Public Records
Mortgage History
| Date | Status | Borrower | Loan Amount |
|---|---|---|---|
| Open | Chowdhury Mohammed Alauddin | $271,800 |
Source: Public Records
Tax History
| Year | Tax Paid | Tax Assessment Tax Assessment Total Assessment is a certain percentage of the fair market value that is determined by local assessors to be the total taxable value of land and additions on the property. | Land | Improvement |
|---|---|---|---|---|
| 2025 | $5,396 | $458,300 | $111,200 | $347,100 |
| 2024 | $5,270 | $458,300 | $111,200 | $347,100 |
| 2023 | $4,784 | $412,400 | $111,200 | $301,200 |
| 2022 | $4,479 | $379,600 | $111,200 | $268,400 |
| 2021 | $4,298 | $336,100 | $106,100 | $230,000 |
| 2020 | $3,975 | $320,600 | $106,100 | $214,500 |
| 2019 | $3,985 | $321,400 | $106,100 | $215,300 |
| 2018 | $4,117 | $327,500 | $106,000 | $221,500 |
| 2017 | $4,155 | $0 | $0 | $0 |
| 2016 | $4,155 | $327,500 | $0 | $0 |
| 2015 | $4,155 | $0 | $0 | $0 |
| 2014 | $4,145 | $327,500 | $106,000 | $221,500 |
Source: Public Records
Map
Nearby Homes
- 39 Edenbrook Dr
- 723 Spruce Rd
- 7 Mary Ann Dr
- 713 Todds Ln
- 727 Willow Dr
- 5 Beaver Castle Ct
- 122 Kendall Dr
- 9 Fallmeadow Ct
- 114 Henry Clay Rd
- 702 Sedgefield Dr
- 85 Haviland Dr
- 14 Post Oak Ct
- 708 Dresden Dr
- 14 Belmont Rd
- 9 Ancel Ct
- 9 Kenilworth Dr
- 719 Michelle Dr
- 691 Dresden Dr
- 727 Bellwood Rd
- 737 Michelle Dr
Your Personal Tour Guide
Ask me questions while you tour the home.