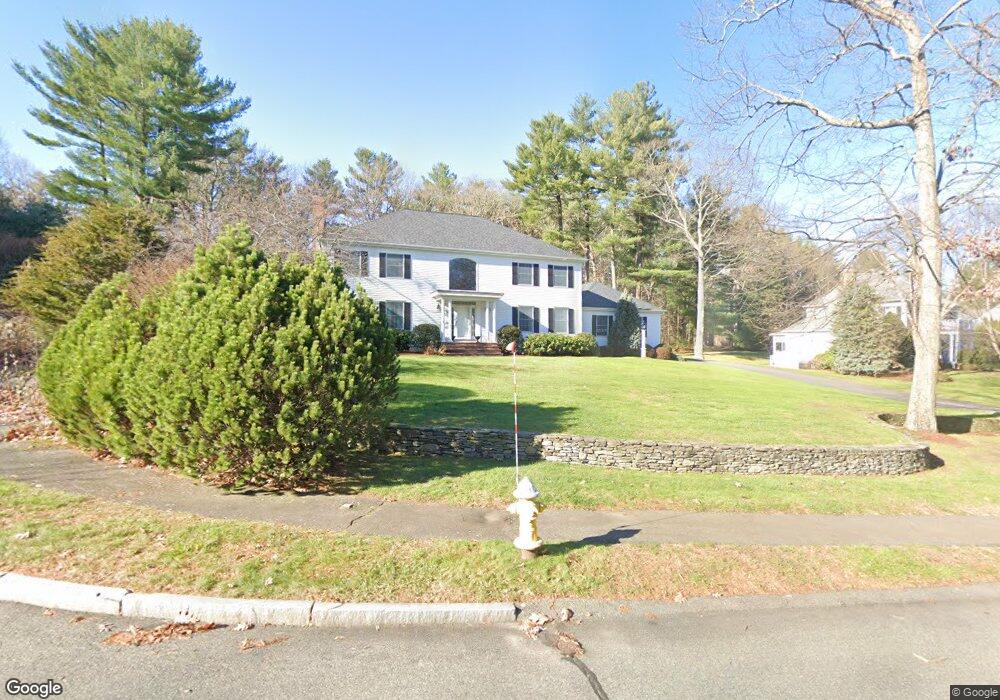
50 Burr Dr Needham, MA 02492
Needham AreaEstimated Value: $1,746,000 - $2,449,000
About This Home
This home is located at 50 Burr Dr, Needham, MA 02492 and is currently estimated at $2,181,234, approximately $962 per square foot. 50 Burr Dr is a home located in Norfolk County with nearby schools including Newman Elementary School, High Rock Middle School, and Pollard Middle School.
Ownership History
We collect this data history from publicly available records. To have your information removed, we recommend requesting removal directly through your county’s website.
Purchase Details
Home Values in the Area
Average Home Value in this Area
Purchase History
We collect this data history from publicly available records. To have your information removed, we recommend requesting removal directly through your county’s website.
| Date | Buyer | Sale Price | Title Company |
|---|---|---|---|
| $295,000 | -- |
Tax History
We collect this data history from publicly available records. To have your information removed, we recommend requesting removal directly through your county’s website.
| Year | Tax Paid | Tax Assessment Tax Assessment Total Assessment is a certain percentage of the fair market value that is determined by local assessors to be the total taxable value of land and additions on the property. | Land | Improvement |
|---|---|---|---|---|
| 2025 | $18,378 | $1,733,800 | $897,900 | $835,900 |
| 2024 | $16,302 | $1,302,100 | $701,300 | $600,800 |
| 2023 | $16,377 | $1,255,900 | $701,300 | $554,600 |
| 2022 | $16,404 | $1,226,900 | $701,300 | $525,600 |
| 2021 | $15,987 | $1,226,900 | $701,300 | $525,600 |
| 2020 | $15,739 | $1,260,100 | $701,300 | $558,800 |
| 2019 | $15,547 | $1,254,800 | $701,300 | $553,500 |
| 2018 | $14,907 | $1,254,800 | $701,300 | $553,500 |
| 2017 | $15,519 | $1,305,200 | $701,300 | $603,900 |
| 2016 | $15,062 | $1,305,200 | $701,300 | $603,900 |
| 2015 | $14,736 | $1,305,200 | $701,300 | $603,900 |
| 2014 | $15,005 | $1,289,100 | $701,300 | $587,800 |
Map
- 957 South St
- 8 Crestview Rd
- 211 High Rock St
- 287 High Rock St
- 533 Chestnut St
- 4 Wilson's Way
- 46 Charles River St
- 181 Dedham St
- 373 High Rock St
- 37 Moseley Ave
- 430 High Rock St
- 456 Chestnut St
- 105 Blake St
- 98 Bridle Trail Rd
- 21 Gayland Rd
- 150 Dedham St
- 91 Henderson St
- 298 Marked Tree Rd
- 1780 Central Ave
- 109 Linden St
Ask me questions while you tour the home.