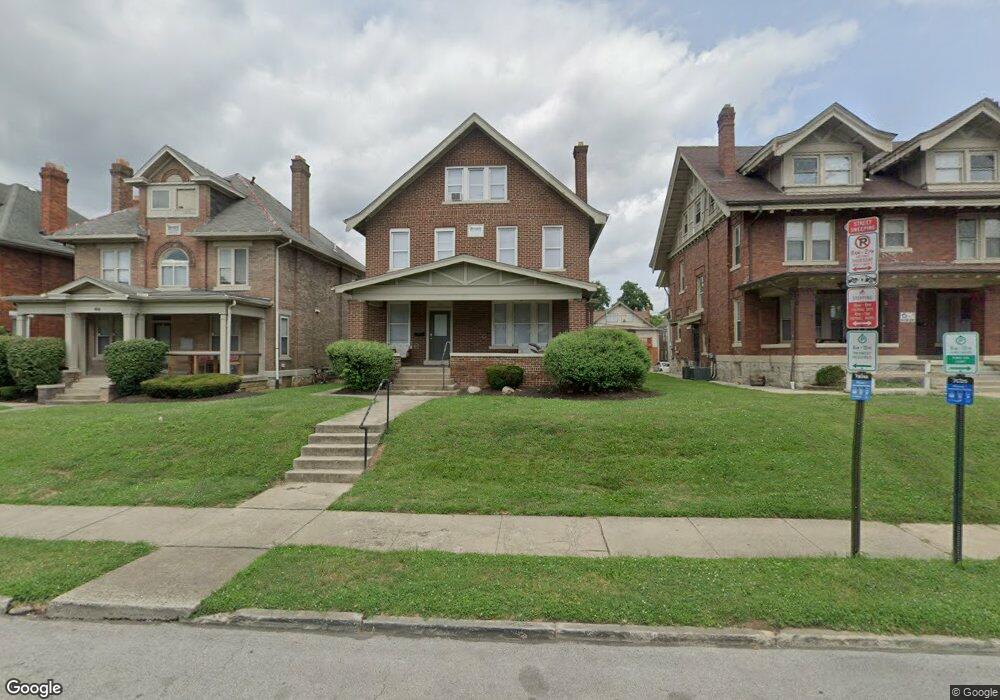
50 E 12th Ave Columbus, OH 43201
Estimated Value: $291,000 - $488,000
7
Beds
3
Baths
2,435
Sq Ft
$158/Sq Ft
Est. Value
About This Home
This home is located at 50 E 12th Ave, Columbus, OH 43201 and is currently estimated at $385,587, approximately $158 per square foot. 50 E 12th Ave is a home located in Franklin County with nearby schools including Weinland Park Elementary School, Dominion Middle School, and Whetstone High School.
Ownership History
Date
Name
Owned For
Owner Type
Purchase Details
Closed on
Mar 30, 2018
Sold by
Windsatr Development Ltd Iii
Bought by
Tworivers Propertries Ltd Llc
Current Estimated Value
Purchase Details
Closed on
Apr 1, 2005
Sold by
Comet Group Iii Ltd
Bought by
Windstar Development Ltd Iii
Purchase Details
Closed on
Dec 15, 2004
Sold by
Comet Group Ltd
Bought by
Comet Group Iii Ltd
Purchase Details
Closed on
Oct 28, 1999
Sold by
Ghg Group
Bought by
Comet Group Ltd
Purchase Details
Closed on
Apr 22, 1998
Sold by
Bubs Pizza & Video Inc
Bought by
Desan Ransier Frederick L and Desan Bankruptcy Case Albert J
Purchase Details
Closed on
Aug 17, 1994
Sold by
Campubs Properties Xii
Bought by
Bubs Pizza & Video Inc
Create a Home Valuation Report for This Property
The Home Valuation Report is an in-depth analysis detailing your home's value as well as a comparison with similar homes in the area
Purchase History
| Date | Buyer | Sale Price | Title Company |
|---|---|---|---|
| Tworivers Propertries Ltd Llc | -- | None Available | |
| Windstar Development Ltd Iii | -- | Title Co Lt | |
| Comet Group Iii Ltd | -- | -- | |
| Comet Group Ltd | -- | Hummel Title Agency Inc | |
| Ghg Group | -- | Hummel Title Agency Inc | |
| Desan Ransier Frederick L | -- | -- | |
| Bubs Pizza & Video Inc | $120,000 | -- |
Source: Public Records
Tax History
| Year | Tax Paid | Tax Assessment Tax Assessment Total Assessment is a certain percentage of the fair market value that is determined by local assessors to be the total taxable value of land and additions on the property. | Land | Improvement |
|---|---|---|---|---|
| 2025 | $4,219 | $92,060 | $39,100 | $52,960 |
| 2024 | $4,219 | $92,060 | $39,100 | $52,960 |
| 2023 | $4,166 | $92,060 | $39,100 | $52,960 |
| 2022 | $5,776 | $108,680 | $35,950 | $72,730 |
| 2021 | $5,786 | $108,680 | $35,950 | $72,730 |
| 2020 | $5,795 | $108,680 | $35,950 | $72,730 |
| 2019 | $5,877 | $94,510 | $31,260 | $63,250 |
| 2018 | $5,586 | $94,510 | $31,260 | $63,250 |
| 2017 | $5,851 | $94,510 | $31,260 | $63,250 |
| 2016 | $5,826 | $85,760 | $31,260 | $54,500 |
| 2015 | $5,304 | $85,760 | $31,260 | $54,500 |
| 2014 | $5,317 | $85,760 | $31,260 | $54,500 |
| 2013 | $2,623 | $85,750 | $31,255 | $54,495 |
Source: Public Records
Map
Nearby Homes
- 76 Chittenden Ave
- 1777 Summit St
- 288 E 14th Ave
- 27 W 8th Ave
- 1440-1442 Hamlet St
- 93 King Ave Unit 95
- 1520 Neil Ave
- 335 E 18th Ave Unit 333
- 408 E 14th Ave
- 384 E 17th Ave
- 1411 N 5th St
- 1342 Hamlet St Unit 344
- 445 E 16th Ave
- 63 Smith Place
- 1336 N 5th St Unit 338
- 1376 N 6th St
- 1988 1990 N 4th St
- 1359 Neil Ave
- 1331 Neil Ave Unit 1331
- 9 E Norwich Ave Unit 15
- 44 E 12th Ave
- 38 E 12th Ave
- 34 E 12th Ave
- 55 E 13th Ave
- 65 E 13th Ave
- 53 E 12th Ave
- 51 E 13th Ave
- 71 E 13th Ave
- 47 E 12th Ave
- 31 E 12th Ave
- 14 E 12th Ave
- 1694 N High St
- 1661 N Pearl St
- 1714 N High St
- 8 E 12th Ave
- 50 Chittenden Ave
- 68 E 13th Ave
- 40-42 Chittenden Ave
- 34 Chittenden Ave
- 44 Chittenden Ave Unit 46
Your Personal Tour Guide
Ask me questions while you tour the home.