Estimated Value: $2,462,000 - $2,899,000
3
Beds
2
Baths
2,070
Sq Ft
$1,248/Sq Ft
Est. Value
About This Home
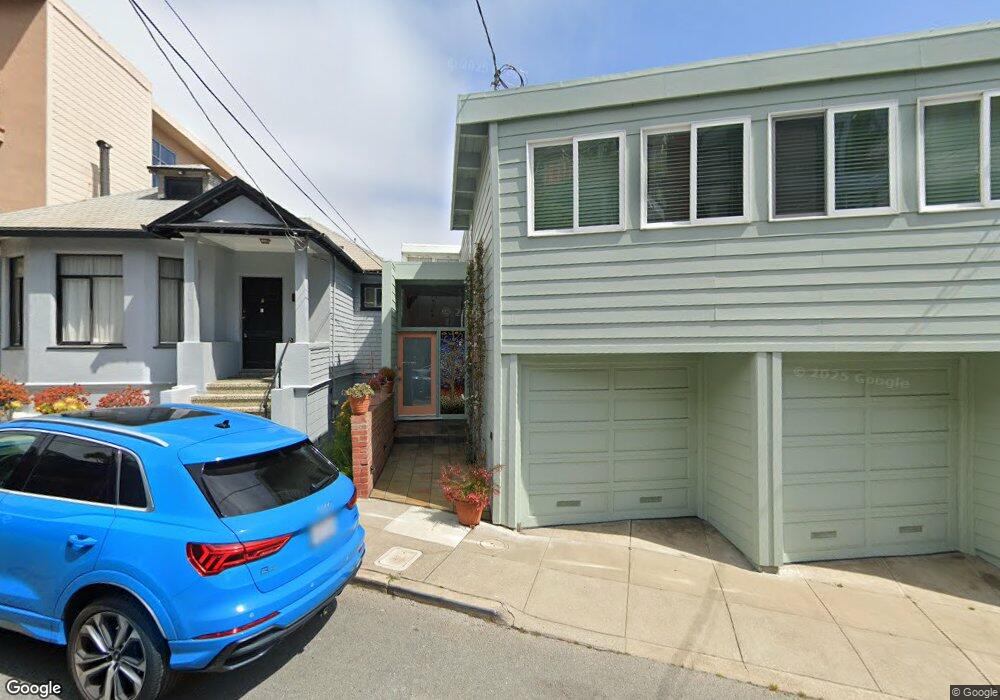
This home is located at 50 Eagle St, San Francisco, CA 94114 and is currently estimated at $2,582,508, approximately $1,247 per square foot. 50 Eagle St is a home located in San Francisco County with nearby schools including Harvey Milk Civil Rights Academy, Everett Middle School, and St. Philip School.
Ownership History
Date
Name
Owned For
Owner Type
Purchase Details
Closed on
Aug 27, 1996
Sold by
Conte James T
Bought by
Conte James Thomas
Current Estimated Value
Purchase Details
Closed on
Mar 11, 1996
Sold by
Ray Charles C
Bought by
Conte James T
Home Financials for this Owner
Home Financials are based on the most recent Mortgage that was taken out on this home.
Original Mortgage
$452,000
Interest Rate
6.55%
Purchase Details
Closed on
Feb 6, 1996
Sold by
Jones Kim
Bought by
Ray Charles C
Home Financials for this Owner
Home Financials are based on the most recent Mortgage that was taken out on this home.
Original Mortgage
$452,000
Interest Rate
6.55%
Purchase Details
Closed on
Dec 13, 1993
Sold by
Ray Charles C and Ray Molly O
Bought by
Ray Charles C
Create a Home Valuation Report for This Property
The Home Valuation Report is an in-depth analysis detailing your home's value as well as a comparison with similar homes in the area
Home Values in the Area
Average Home Value in this Area
Purchase History
| Date | Buyer | Sale Price | Title Company |
|---|---|---|---|
| Conte James Thomas | -- | -- | |
| Conte James T | $565,000 | Fidelity National Title Ins | |
| Ray Charles C | -- | Fidelity National Title Ins | |
| Ray Charles C | -- | -- |
Source: Public Records
Mortgage History
| Date | Status | Borrower | Loan Amount |
|---|---|---|---|
| Closed | Conte James T | $452,000 |
Source: Public Records
Tax History
| Year | Tax Paid | Tax Assessment Tax Assessment Total Assessment is a certain percentage of the fair market value that is determined by local assessors to be the total taxable value of land and additions on the property. | Land | Improvement |
|---|---|---|---|---|
| 2025 | $10,808 | $938,598 | $498,372 | $440,226 |
| 2024 | $10,808 | $920,195 | $488,600 | $431,595 |
| 2023 | $10,653 | $902,153 | $479,020 | $423,133 |
| 2022 | $10,463 | $884,465 | $469,628 | $414,837 |
| 2021 | $10,282 | $867,123 | $460,420 | $406,703 |
| 2020 | $10,313 | $858,232 | $455,699 | $402,533 |
| 2019 | $9,958 | $841,405 | $446,764 | $394,641 |
| 2018 | $9,623 | $824,907 | $438,004 | $386,903 |
| 2017 | $9,510 | $808,733 | $429,416 | $379,317 |
| 2016 | $9,346 | $792,877 | $420,997 | $371,880 |
| 2015 | $9,498 | $780,969 | $414,674 | $366,295 |
| 2014 | $8,988 | $765,672 | $406,552 | $359,120 |
Source: Public Records
Map
Nearby Homes
- 4799 19th St
- 321 Caselli Ave
- 3348 Market St
- 176 Caselli Ave
- 473 Corbett Ave
- 3412 Market St
- 465 Corbett Ave
- 98 Caselli Ave
- 468 Corbett Ave
- 892 Corbett Ave
- 2081 2083 15th
- 250 Douglass St
- 316 Douglass St
- 4376 17th St
- 4431 19th St
- 130 Grand View Ave
- 150 Eureka St Unit C
- 136 Saturn St
- 1180 Clayton St
- 342 Upper Terrace
Your Personal Tour Guide
Ask me questions while you tour the home.