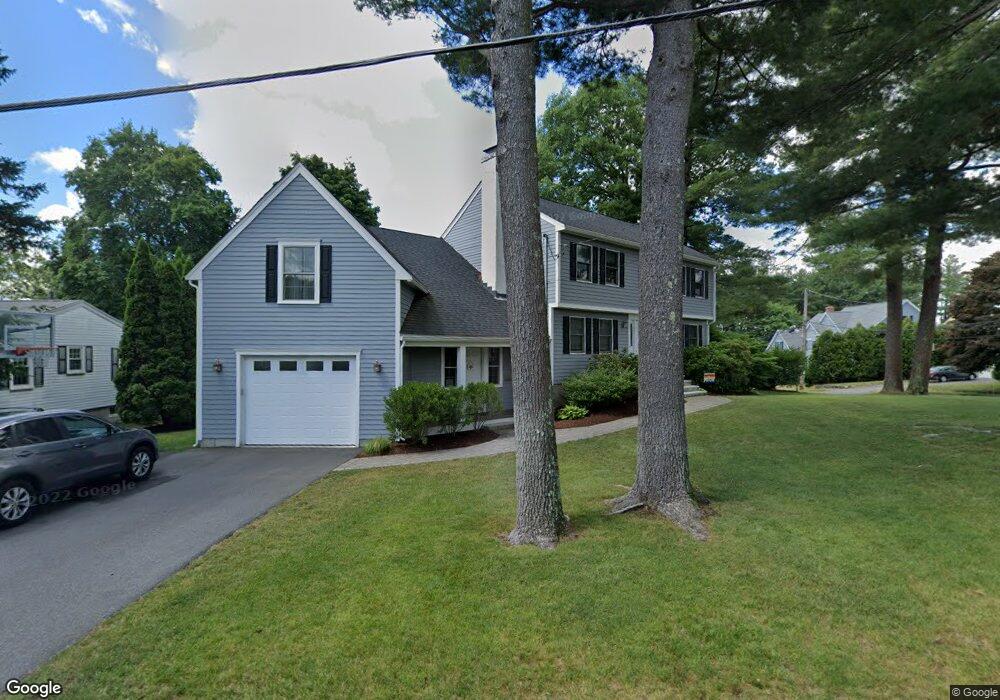
50 Fuller Rd Unit 1 Needham, MA 02492
Estimated Value: $1,320,000 - $1,613,000
3
Beds
3
Baths
2,475
Sq Ft
$599/Sq Ft
Est. Value
About This Home
This home is located at 50 Fuller Rd Unit 1, Needham, MA 02492 and is currently estimated at $1,481,900, approximately $598 per square foot. 50 Fuller Rd Unit 1 is a home located in Norfolk County with nearby schools including Broadmeadow Elementary School, High Rock Middle School, and Pollard Middle School.
Ownership History
Date
Name
Owned For
Owner Type
Purchase Details
Closed on
May 11, 2006
Sold by
Torre Nestor A and Batlle Marta
Bought by
Massachusetts Res Nt and National Res Nt
Current Estimated Value
Home Financials for this Owner
Home Financials are based on the most recent Mortgage that was taken out on this home.
Original Mortgage
$33,325
Interest Rate
6.4%
Mortgage Type
Purchase Money Mortgage
Purchase Details
Closed on
Mar 28, 2005
Sold by
Lawlor Robert P and Lawlor Stephanie
Bought by
Batlle Marta and Torre Nestor A
Purchase Details
Closed on
May 3, 1993
Sold by
Fitzgerald William F and Fitzgerald Mary A
Bought by
Lawlor Robert P and Lawlor Stephanie
Purchase Details
Closed on
Oct 13, 1989
Sold by
Est Chase Robert E
Bought by
Fitzgerald William F
Create a Home Valuation Report for This Property
The Home Valuation Report is an in-depth analysis detailing your home's value as well as a comparison with similar homes in the area
Home Values in the Area
Average Home Value in this Area
Purchase History
| Date | Buyer | Sale Price | Title Company |
|---|---|---|---|
| Massachusetts Res Nt | $666,500 | -- | |
| Massachusetts Res Nt | $666,500 | -- | |
| Verma Daya D | $666,500 | -- | |
| Massachusetts Res Nt | $666,500 | -- | |
| Batlle Marta | $650,000 | -- | |
| Batlle Marta | $650,000 | -- | |
| Lawlor Robert P | $183,000 | -- | |
| Lawlor Robert P | $183,000 | -- | |
| Fitzgerald William F | $180,000 | -- | |
| Fitzgerald William F | $180,000 | -- |
Source: Public Records
Mortgage History
| Date | Status | Borrower | Loan Amount |
|---|---|---|---|
| Open | Fitzgerald William F | $552,000 | |
| Closed | Massachusetts Res Nt | $33,325 | |
| Closed | Massachusetts Res Nt | $599,850 |
Source: Public Records
Tax History
| Year | Tax Paid | Tax Assessment Tax Assessment Total Assessment is a certain percentage of the fair market value that is determined by local assessors to be the total taxable value of land and additions on the property. | Land | Improvement |
|---|---|---|---|---|
| 2025 | $12,694 | $1,197,500 | $800,300 | $397,200 |
| 2024 | $13,505 | $1,078,700 | $581,200 | $497,500 |
| 2023 | $13,584 | $1,041,700 | $581,200 | $460,500 |
| 2022 | $13,044 | $975,600 | $538,200 | $437,400 |
| 2021 | $12,712 | $975,600 | $538,200 | $437,400 |
| 2020 | $12,619 | $1,010,300 | $538,200 | $472,100 |
| 2019 | $11,793 | $951,800 | $489,300 | $462,500 |
| 2018 | $10,957 | $922,300 | $489,300 | $433,000 |
| 2017 | $10,370 | $872,200 | $489,300 | $382,900 |
| 2016 | $8,397 | $727,600 | $489,300 | $238,300 |
| 2015 | $8,215 | $727,600 | $489,300 | $238,300 |
| 2014 | $7,651 | $657,300 | $425,500 | $231,800 |
Source: Public Records
Map
Nearby Homes
- 60 Douglas Rd
- 28 Green St
- 31 Birds Hill Ave
- 126 Prince St
- 883 Greendale Ave
- 103 Aletha Rd
- 37 Cottage Cir
- 37 Cottage Cir Unit 37
- 1204 Greendale Ave Unit 128
- 1202 Greendale Ave Unit 124
- 50 Sterling Rd
- 1212 Greendale Ave Unit 300
- 1206 Greendale Ave Unit 217
- 1206 Greendale Ave Unit 201
- 176 Highgate St
- 242 Valley Rd
- 100 Bradford St
- 60 Sutton Rd
- 36 Otis St Unit 36
- 1034 Webster St
- 50 Fuller Rd
- 44 Fuller Rd
- 9 Elmwood Rd
- 349 Great Plain Ave
- 33 Elmwood Rd
- 38 Fuller Rd
- 20 Elmwood Rd
- 26 Elmwood Rd
- 341 Great Plain Ave
- 14 Elmwood Rd
- 32 Elmwood Rd
- 6 Elmwood Rd
- 37 Fuller Rd
- 337 Great Plain Ave
- 30 Fuller Rd
- 38 Elmwood Rd
- 41 Elmwood Rd
- 31 Fuller Rd
- 329 Great Plain Ave
- 371 Great Plain Ave
Your Personal Tour Guide
Ask me questions while you tour the home.