
Seller's Agent in 2026
Jennifer Priest
Coldwell Banker Realty - Andovers/Readings Regional
(978) 808-6485
1 in this area
9 Total Sales
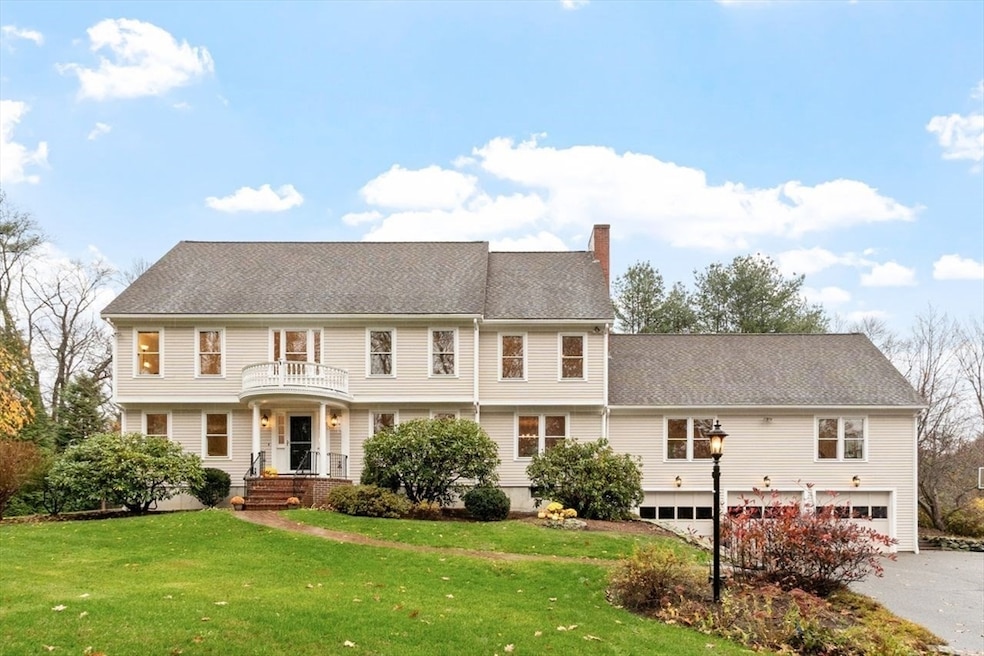


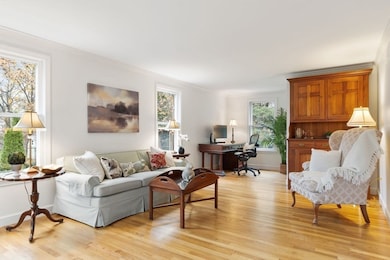
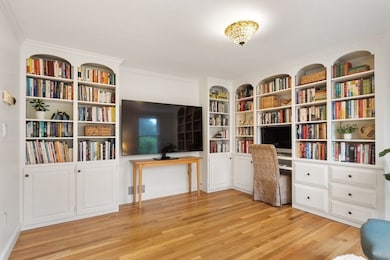
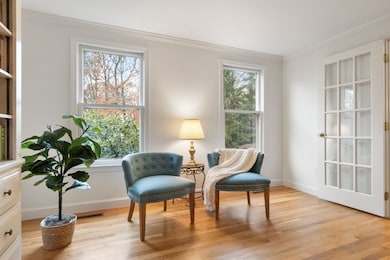
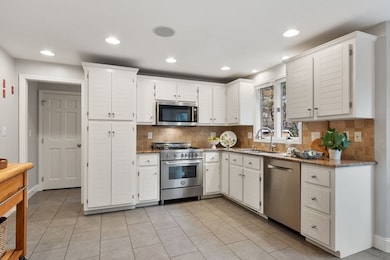
This stately center-entrance Colonial in sought-after South Andover offers convenient access to Pike School, Phillips Academy and downtown. The bright two-story foyer opens to a formal living room with crown molding, opposite a den/library with built-ins — ideal for a home office. The sunny eat-in kitchen features granite counters, neutral cabinetry, a Bertazzoni stainless range/oven and gray ceramic tile flooring. A dining room with fireplace opens to the patio for seamless entertaining. An enormous family room over the 3-car garage has vaulted ceilings and a half bath, offering great space for gatherings or a future home theater. Upstairs are four bedrooms, including a spacious primary suite with fireplace, bay window sitting area, double closets and en-suite bath. A walk-up attic provides excellent storage and expansion potential with heating capacity in place. Landscaped grounds include a private patio, well-built chicken coop and raised bed garden for fresh eggs and produce.
Last Agent to Sell the Property
Coldwell Banker Realty - Andovers/Readings Regional Listed on: 11/12/2025
| Date | Type | Sale Price | Title Company |
|---|---|---|---|
| Quit Claim Deed | $1,580,000 | -- | |
| Deed | $950,000 | -- | |
| Deed | $694,900 | -- |
| Date | Status | Loan Amount | Loan Type |
|---|---|---|---|
| Open | $1,264,000 | Purchase Money Mortgage | |
| Previous Owner | $508,000 | No Value Available | |
| Previous Owner | $170,000 | Unknown |
| Date | Event | Price | List to Sale | Price per Sq Ft |
|---|---|---|---|---|
| 01/20/2026 01/20/26 | Sold | $1,580,000 | +10.9% | $421 / Sq Ft |
| 11/19/2025 11/19/25 | Pending | -- | -- | -- |
| 11/12/2025 11/12/25 | For Sale | $1,425,000 | -- | $379 / Sq Ft |
| Year | Tax Paid | Tax Assessment Tax Assessment Total Assessment is a certain percentage of the fair market value that is determined by local assessors to be the total taxable value of land and additions on the property. | Land | Improvement |
|---|---|---|---|---|
| 2024 | $18,630 | $1,446,400 | $671,700 | $774,700 |
| 2023 | $17,855 | $1,307,100 | $605,000 | $702,100 |
| 2022 | $16,831 | $1,152,800 | $526,200 | $626,600 |
| 2021 | $16,151 | $1,056,300 | $478,300 | $578,000 |
| 2020 | $15,537 | $1,035,100 | $466,500 | $568,600 |
| 2019 | $15,469 | $1,013,000 | $453,000 | $560,000 |
| 2018 | $14,899 | $952,600 | $435,600 | $517,000 |
| 2017 | $14,304 | $942,300 | $426,900 | $515,400 |
| 2016 | $14,020 | $946,000 | $426,900 | $519,100 |
| 2015 | $13,494 | $901,400 | $410,300 | $491,100 |
Seller's Agent in 2026
Jennifer Priest
Coldwell Banker Realty - Andovers/Readings Regional
(978) 808-6485
1 in this area
9 Total Sales
Buyer's Agent in 2026
Souzan Davood
Coldwell Banker Realty - Newton
(617) 852-5797
2 in this area
36 Total Sales
Source: MLS Property Information Network (MLS PIN)
MLS Number: 73453946
APN: ANDO-000078-000023-A000000
Disclaimer: Certain information contained herein is derived from information provided by parties other than Homes.com. All information provided is deemed reliable, but is not guaranteed to be accurate and should be independently verified.
![]() The property listing data and information, or the Images, set forth herein were provided to MLS Property Information Network, Inc. from third party sources, including sellers, lessors and public records, and were compiled by MLS Property Information Network, Inc. The property listing data and information, and the Images, are for the personal, non-commercial use of consumers having a good faith interest in purchasing or leasing listed properties of the type displayed to them and may not be used for any purpose other than to identify prospective properties which such consumers may have a good faith interest in purchasing or leasing. MLS Property Information Network, Inc. and its subscribers disclaim any and all representations and warranties as to the accuracy of the property listing data and information, or as to the accuracy of any of the Images, set forth herein.
The property listing data and information, or the Images, set forth herein were provided to MLS Property Information Network, Inc. from third party sources, including sellers, lessors and public records, and were compiled by MLS Property Information Network, Inc. The property listing data and information, and the Images, are for the personal, non-commercial use of consumers having a good faith interest in purchasing or leasing listed properties of the type displayed to them and may not be used for any purpose other than to identify prospective properties which such consumers may have a good faith interest in purchasing or leasing. MLS Property Information Network, Inc. and its subscribers disclaim any and all representations and warranties as to the accuracy of the property listing data and information, or as to the accuracy of any of the Images, set forth herein.
Ask me questions while you tour the home.