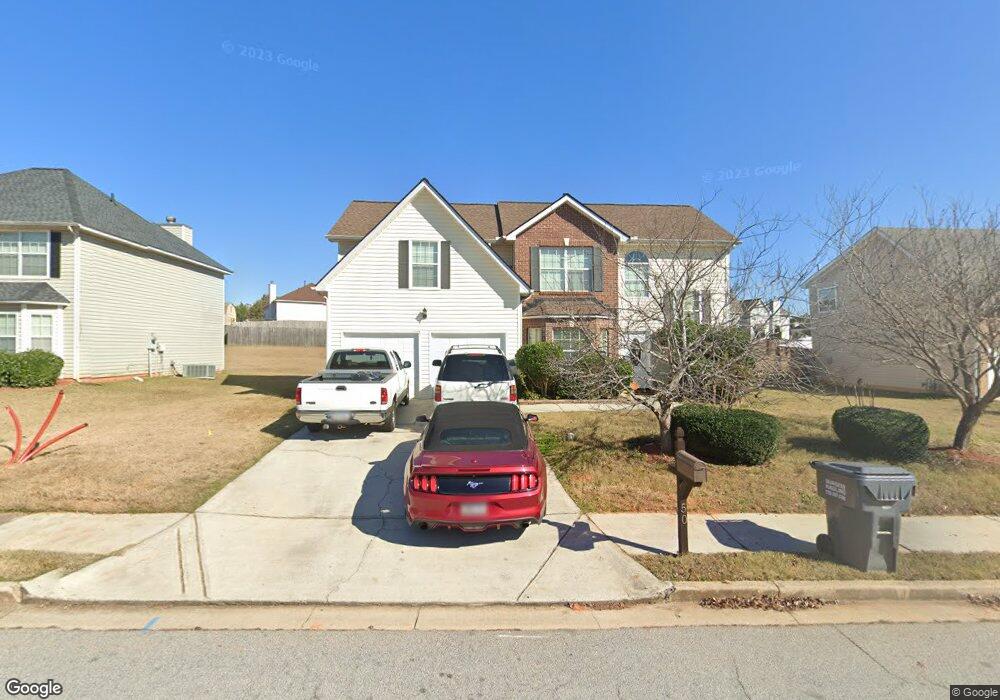
50 Lakeview Crossing Dr Covington, GA 30016
Estimated Value: $301,331 - $308,000
Studio
2
Baths
1,930
Sq Ft
$158/Sq Ft
Est. Value
About This Home
This home is located at 50 Lakeview Crossing Dr, Covington, GA 30016 and is currently estimated at $305,083, approximately $158 per square foot. 50 Lakeview Crossing Dr is a home located in Newton County with nearby schools including Live Oak Elementary School, Clements Middle School, and Newton High School.
Ownership History
Date
Name
Owned For
Owner Type
Purchase Details
Closed on
Apr 10, 2019
Sold by
Smith Karsten
Bought by
Smith Monike and Smith Karsten L
Current Estimated Value
Home Financials for this Owner
Home Financials are based on the most recent Mortgage that was taken out on this home.
Original Mortgage
$145,299
Outstanding Balance
$127,799
Interest Rate
4.62%
Mortgage Type
FHA
Estimated Equity
$177,284
Purchase Details
Closed on
Oct 3, 2008
Sold by
Luminent Mtg Trust 2007-2
Bought by
Smith Karsten
Home Financials for this Owner
Home Financials are based on the most recent Mortgage that was taken out on this home.
Original Mortgage
$117,860
Interest Rate
6.36%
Mortgage Type
FHA
Purchase Details
Closed on
Oct 12, 2006
Sold by
Legacy Cmntys Of Oakwood Manor
Bought by
Harmon Henrietta
Home Financials for this Owner
Home Financials are based on the most recent Mortgage that was taken out on this home.
Original Mortgage
$152,300
Interest Rate
6.39%
Mortgage Type
New Conventional
Create a Home Valuation Report for This Property
The Home Valuation Report is an in-depth analysis detailing your home's value as well as a comparison with similar homes in the area
Home Values in the Area
Average Home Value in this Area
Purchase History
| Date | Buyer | Sale Price | Title Company |
|---|---|---|---|
| Smith Monike | -- | -- | |
| Smith Karsten | $118,500 | -- | |
| Harmon Henrietta | $160,400 | -- |
Source: Public Records
Mortgage History
| Date | Status | Borrower | Loan Amount |
|---|---|---|---|
| Open | Smith Monike | $145,299 | |
| Previous Owner | Smith Karsten | $117,860 | |
| Previous Owner | Harmon Henrietta | $152,300 |
Source: Public Records
Tax History
| Year | Tax Paid | Tax Assessment Tax Assessment Total Assessment is a certain percentage of the fair market value that is determined by local assessors to be the total taxable value of land and additions on the property. | Land | Improvement |
|---|---|---|---|---|
| 2025 | $3,047 | $120,520 | $20,000 | $100,520 |
| 2024 | $3,086 | $119,920 | $20,000 | $99,920 |
| 2023 | $3,220 | $116,880 | $8,000 | $108,880 |
| 2022 | $2,667 | $96,520 | $8,000 | $88,520 |
| 2021 | $1,987 | $63,920 | $8,000 | $55,920 |
| 2020 | $1,992 | $57,920 | $8,000 | $49,920 |
| 2019 | $1,972 | $56,440 | $8,000 | $48,440 |
| 2018 | $1,870 | $53,120 | $10,800 | $42,320 |
| 2017 | $1,865 | $52,960 | $10,800 | $42,160 |
| 2016 | $1,782 | $50,560 | $8,400 | $42,160 |
| 2015 | $1,610 | $45,560 | $8,400 | $37,160 |
| 2014 | $1,427 | $40,360 | $0 | $0 |
Source: Public Records
Map
Nearby Homes
- 40 Oak Terrace Dr
- 353 Crowell Rd N
- 40 Bermuda Cir
- 150 Stephanie Ln
- 130 Stephanie Ln Unit 5
- 185 Stephanie Ln
- 106 Kirkland Rd
- 120 Dunning Keep Unit 2
- 220 Doubles Dr Unit 3
- 65 Westover Place Unit 1
- 11565 Brown Bridge Rd
- 11637 Brown Bridge Rd
- 160 Princeton Way
- 30 Capeton Ct
- 115 Tanners Ct
- 80 Beaverdam Ct
- 290 Trelawney Dr
- 200 Syracuse Ln
- 11889 Brown Bridge Rd
- 65 Beaverdam Ct
- 40 Lakeview Crossing Dr
- 60 Lakeview Crossing Dr
- 60 Lakeview Crossing Dr Unit 1
- 195 Hillside Oak Ln
- 70 Lakeview Crossing Dr
- 30 Lakeview Crossing Dr
- 205 Hillside Oak Ln
- 185 Hillside Oak Ln
- 55 Lakeview Crossing Dr
- 65 Lakeview Crossing Dr
- 45 Lakeview Crossing Dr
- 130 Oak Manor Dr
- 75 Lakeview Crossing Dr
- 175 Hillside Oak Ln
- 20 Lakeview Crossing Dr
- 35 Lakeview Crossing Dr
- 140 Oak Manor Dr Unit 1
- 100 Oak Manor Dr
- 215 Hillside Oak Ln
- 25 Lakeview Crossing Dr
Your Personal Tour Guide
Ask me questions while you tour the home.