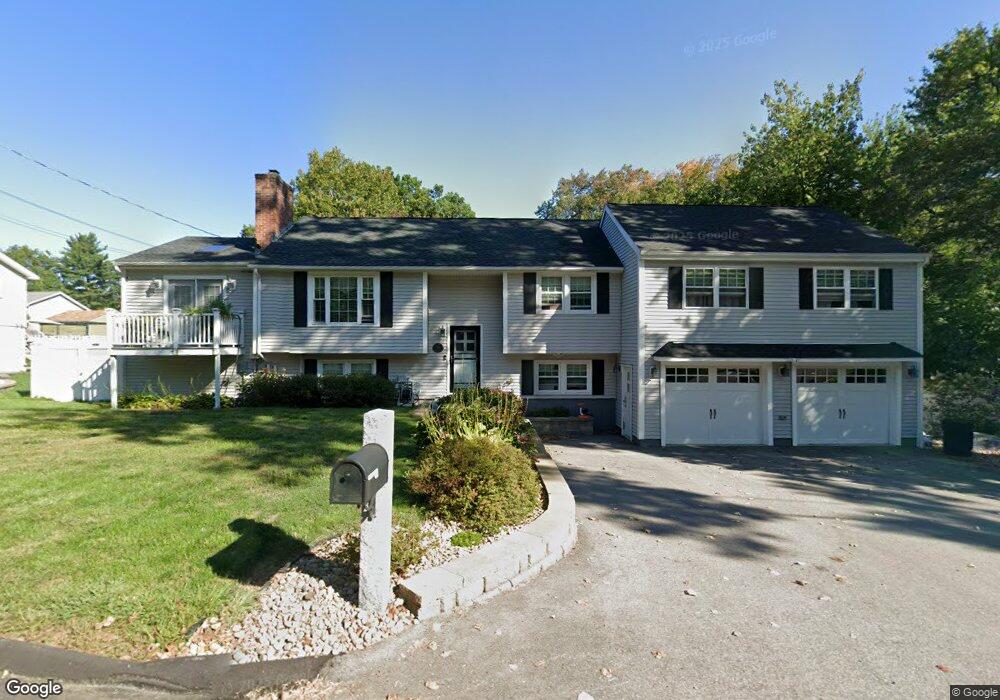
50 Langholm Dr Nashua, NH 03062
Southwest Nashua NeighborhoodEstimated Value: $645,000 - $684,000
4
Beds
3
Baths
1,852
Sq Ft
$361/Sq Ft
Est. Value
About This Home
This home is located at 50 Langholm Dr, Nashua, NH 03062 and is currently estimated at $668,589, approximately $361 per square foot. 50 Langholm Dr is a home located in Hillsborough County with nearby schools including New Searles School, Fairgrounds Middle School, and Nashua High School South.
Ownership History
Date
Name
Owned For
Owner Type
Purchase Details
Closed on
Dec 31, 2019
Sold by
White Deanne M
Bought by
White Deanne M and White Donald E
Current Estimated Value
Home Financials for this Owner
Home Financials are based on the most recent Mortgage that was taken out on this home.
Original Mortgage
$354,400
Outstanding Balance
$227,997
Interest Rate
3.6%
Mortgage Type
New Conventional
Estimated Equity
$440,592
Purchase Details
Closed on
Jul 14, 2017
Sold by
White Donald E and White Deann M
Bought by
White Deann M
Purchase Details
Closed on
Apr 5, 2006
Sold by
Smith Joseph A
Bought by
White Donald E and White Deanne M
Purchase Details
Closed on
Dec 2, 2002
Sold by
Obrien Robert
Bought by
Smith Joseph A
Purchase Details
Closed on
May 1, 1997
Sold by
Roberts Joseph F and Roberts Linda L
Bought by
Obrien Robert P
Create a Home Valuation Report for This Property
The Home Valuation Report is an in-depth analysis detailing your home's value as well as a comparison with similar homes in the area
Home Values in the Area
Average Home Value in this Area
Purchase History
| Date | Buyer | Sale Price | Title Company |
|---|---|---|---|
| White Deanne M | -- | None Available | |
| White Deann M | -- | -- | |
| White Donald E | $284,000 | -- | |
| Smith Joseph A | $240,000 | -- | |
| Obrien Robert P | $124,000 | -- |
Source: Public Records
Mortgage History
| Date | Status | Borrower | Loan Amount |
|---|---|---|---|
| Open | White Deanne M | $354,400 | |
| Previous Owner | Obrien Robert P | $248,270 | |
| Previous Owner | Obrien Robert P | $260,176 | |
| Previous Owner | Obrien Robert P | $47,000 |
Source: Public Records
Tax History Compared to Growth
Tax History
| Year | Tax Paid | Tax Assessment Tax Assessment Total Assessment is a certain percentage of the fair market value that is determined by local assessors to be the total taxable value of land and additions on the property. | Land | Improvement |
|---|---|---|---|---|
| 2024 | $10,289 | $647,100 | $163,500 | $483,600 |
| 2023 | $9,937 | $545,100 | $130,800 | $414,300 |
| 2022 | $9,850 | $545,100 | $130,800 | $414,300 |
| 2021 | $8,148 | $350,900 | $87,200 | $263,700 |
| 2020 | $7,934 | $350,900 | $87,200 | $263,700 |
| 2019 | $6,587 | $302,700 | $87,200 | $215,500 |
| 2018 | $6,327 | $298,300 | $87,200 | $211,100 |
| 2017 | $6,236 | $241,800 | $67,800 | $174,000 |
| 2016 | $6,062 | $241,800 | $67,800 | $174,000 |
| 2015 | $5,931 | $241,800 | $67,800 | $174,000 |
| 2014 | $5,479 | $227,800 | $67,800 | $160,000 |
Source: Public Records
Map
Nearby Homes
- 5 Wilderness Dr
- 188 Harris Rd
- 15 Westray Dr
- 31 Tenby Dr
- 33 Cannon Dr
- 57 Wethersfield Rd
- 23 Glen Dr
- 375 Main Dunstable Rd
- 29 Greenwood Dr
- 4 Henry David Dr Unit 203
- 25 Cortez Dr Unit U57
- 29 Dickens St
- 285 E Dunstable Rd
- 51 Legacy Dr
- 10 Lamb Rd
- 16 Laurel Ct Unit U320
- 18 Cadogan Way Unit UY250
- 7 Doucet Ave
- 32 Cadogan Way Unit UZ257
- 61 Wilderness Dr