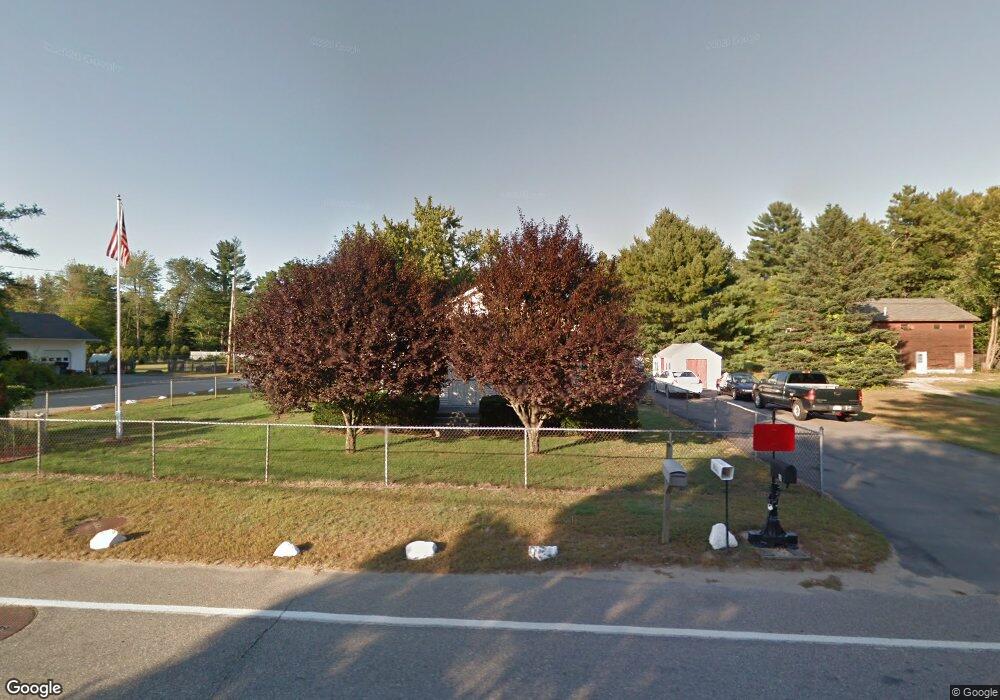
50 Lowell St Rochester, NH 03867
Estimated Value: $334,000 - $358,405
2
Beds
2
Baths
836
Sq Ft
$415/Sq Ft
Est. Value
About This Home
This home is located at 50 Lowell St, Rochester, NH 03867 and is currently estimated at $347,351, approximately $415 per square foot. 50 Lowell St is a home located in Strafford County with nearby schools including William Allen School, Rochester Middle School, and Spaulding High School.
Ownership History
Date
Name
Owned For
Owner Type
Purchase Details
Closed on
Nov 10, 1998
Sold by
Mcnally James F and Mcnally Linda J
Bought by
Poligni Stephen J and Poligni Penny L
Current Estimated Value
Home Financials for this Owner
Home Financials are based on the most recent Mortgage that was taken out on this home.
Original Mortgage
$74,438
Interest Rate
6.64%
Create a Home Valuation Report for This Property
The Home Valuation Report is an in-depth analysis detailing your home's value as well as a comparison with similar homes in the area
Home Values in the Area
Average Home Value in this Area
Purchase History
| Date | Buyer | Sale Price | Title Company |
|---|---|---|---|
| Poligni Stephen J | $74,500 | -- |
Source: Public Records
Mortgage History
| Date | Status | Borrower | Loan Amount |
|---|---|---|---|
| Open | Poligni Stephen J | $164,000 | |
| Closed | Poligni Stephen J | $74,438 |
Source: Public Records
Tax History Compared to Growth
Tax History
| Year | Tax Paid | Tax Assessment Tax Assessment Total Assessment is a certain percentage of the fair market value that is determined by local assessors to be the total taxable value of land and additions on the property. | Land | Improvement |
|---|---|---|---|---|
| 2024 | $4,501 | $303,100 | $82,600 | $220,500 |
| 2023 | $4,625 | $179,700 | $53,300 | $126,400 |
| 2022 | $4,543 | $179,700 | $53,300 | $126,400 |
| 2021 | $4,430 | $179,700 | $53,300 | $126,400 |
| 2020 | $4,417 | $179,500 | $53,300 | $126,200 |
| 2019 | $4,470 | $179,500 | $53,300 | $126,200 |
| 2018 | $4,208 | $152,900 | $40,000 | $112,900 |
| 2017 | $4,026 | $152,900 | $40,000 | $112,900 |
| 2016 | $3,880 | $137,300 | $40,000 | $97,300 |
| 2015 | $3,865 | $137,300 | $40,000 | $97,300 |
| 2014 | $3,772 | $137,300 | $40,000 | $97,300 |
| 2013 | $4,133 | $156,800 | $53,300 | $103,500 |
| 2012 | $4,027 | $156,800 | $53,300 | $103,500 |
Source: Public Records
Map
Nearby Homes