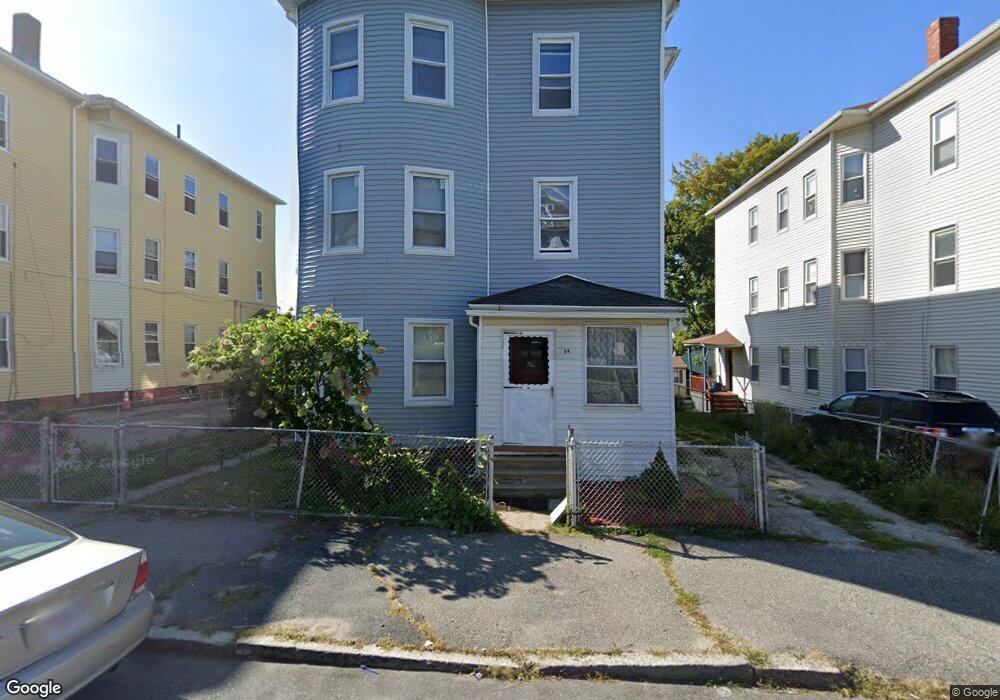
50 Perry Ave Unit 3 Worcester, MA 01610
Vernon Hill NeighborhoodEstimated Value: $510,057 - $764,000
3
Beds
1
Bath
1,200
Sq Ft
$559/Sq Ft
Est. Value
About This Home
This home is located at 50 Perry Ave Unit 3, Worcester, MA 01610 and is currently estimated at $670,514, approximately $558 per square foot. 50 Perry Ave Unit 3 is a home located in Worcester County with nearby schools including Jacob Hiatt Magnet School, Quinsigamond School, and Chandler Magnet.
Ownership History
Date
Name
Owned For
Owner Type
Purchase Details
Closed on
Jun 25, 2008
Sold by
Parzych Jan
Bought by
Parzych Jadwiga and Parzych Jan
Current Estimated Value
Home Financials for this Owner
Home Financials are based on the most recent Mortgage that was taken out on this home.
Original Mortgage
$118,500
Outstanding Balance
$76,448
Interest Rate
6.07%
Mortgage Type
Purchase Money Mortgage
Estimated Equity
$594,066
Create a Home Valuation Report for This Property
The Home Valuation Report is an in-depth analysis detailing your home's value as well as a comparison with similar homes in the area
Home Values in the Area
Average Home Value in this Area
Purchase History
| Date | Buyer | Sale Price | Title Company |
|---|---|---|---|
| Parzych Jadwiga | -- | -- | |
| Parzych Jan | $112,200 | -- |
Source: Public Records
Mortgage History
| Date | Status | Borrower | Loan Amount |
|---|---|---|---|
| Open | Parzych Jan | $118,500 |
Source: Public Records
Tax History
| Year | Tax Paid | Tax Assessment Tax Assessment Total Assessment is a certain percentage of the fair market value that is determined by local assessors to be the total taxable value of land and additions on the property. | Land | Improvement |
|---|---|---|---|---|
| 2025 | $7,778 | $589,700 | $81,500 | $508,200 |
| 2024 | $7,162 | $520,900 | $81,500 | $439,400 |
| 2023 | $6,865 | $478,700 | $70,900 | $407,800 |
| 2022 | $5,974 | $392,800 | $56,700 | $336,100 |
| 2021 | $5,276 | $324,100 | $45,400 | $278,700 |
| 2020 | $4,872 | $286,600 | $45,100 | $241,500 |
| 2019 | $4,864 | $270,200 | $39,400 | $230,800 |
| 2018 | $4,079 | $215,700 | $39,400 | $176,300 |
| 2017 | $3,827 | $199,100 | $39,400 | $159,700 |
| 2016 | $3,642 | $176,700 | $28,400 | $148,300 |
| 2015 | $3,546 | $176,700 | $28,400 | $148,300 |
| 2014 | $3,453 | $176,700 | $28,400 | $148,300 |
Source: Public Records
Map
Nearby Homes
- 195 Millbury St
- 13 Sterling St
- 13 Sigel St
- 49 Richland St
- 96 Vernon St
- 172 Perry Ave Unit 1A
- 172 Perry Ave Unit 2B
- 82 Fox St
- 26 South St
- 17 Fairbanks St
- 607 Cambridge St Unit 4
- 1 Arlington St
- 7 Wabash Ave
- 3A Gediminas St
- 49 South St
- 52 Harrison St
- 32 Ames St
- 22 Waverly St
- 20 Washburn St
- 32 Granite St
Your Personal Tour Guide
Ask me questions while you tour the home.