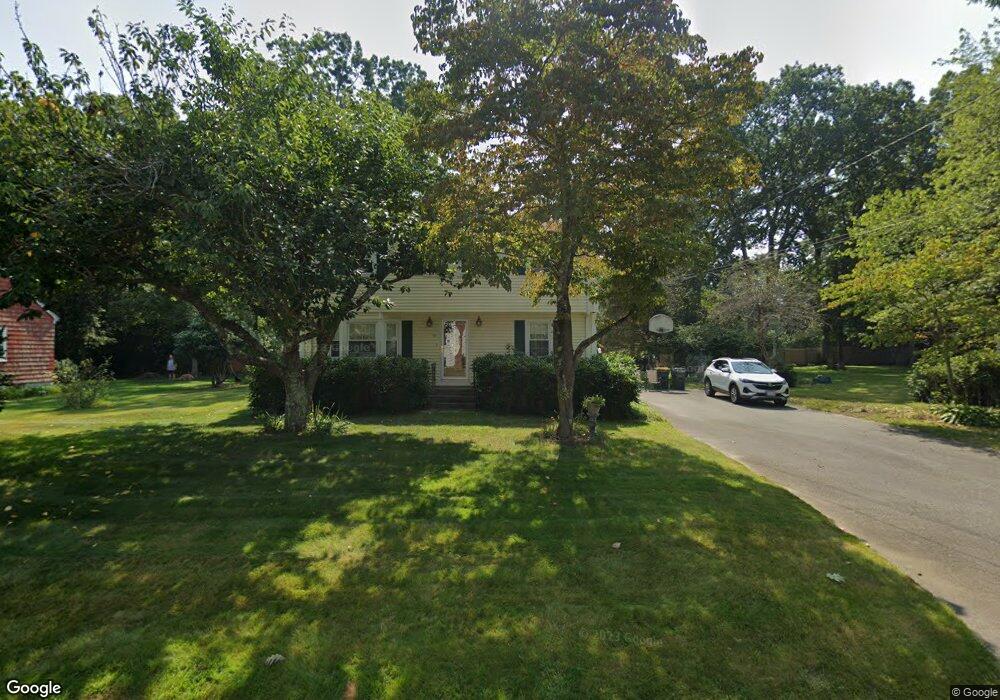
50 Pine St Franklin, MA 02038
Estimated Value: $545,911 - $633,000
4
Beds
2
Baths
1,575
Sq Ft
$374/Sq Ft
Est. Value
About This Home
This home is located at 50 Pine St, Franklin, MA 02038 and is currently estimated at $589,478, approximately $374 per square foot. 50 Pine St is a home located in Norfolk County with nearby schools including John F. Kennedy Memorial School, Horace Mann Middle School, and Franklin High School.
Ownership History
Date
Name
Owned For
Owner Type
Purchase Details
Closed on
Oct 9, 2014
Sold by
Duggan Frank and Duggan Marjorie K
Bought by
Duggan Ret
Current Estimated Value
Purchase Details
Closed on
Oct 20, 1976
Bought by
Duggan Ret
Create a Home Valuation Report for This Property
The Home Valuation Report is an in-depth analysis detailing your home's value as well as a comparison with similar homes in the area
Purchase History
| Date | Buyer | Sale Price | Title Company |
|---|---|---|---|
| Duggan Ret | -- | -- | |
| Duggan Ret | $38,500 | -- |
Source: Public Records
Mortgage History
| Date | Status | Borrower | Loan Amount |
|---|---|---|---|
| Previous Owner | Duggan Ret | $55,000 | |
| Previous Owner | Duggan Ret | $50,000 | |
| Previous Owner | Duggan Ret | $55,000 | |
| Previous Owner | Duggan Ret | $51,000 |
Source: Public Records
Tax History
| Year | Tax Paid | Tax Assessment Tax Assessment Total Assessment is a certain percentage of the fair market value that is determined by local assessors to be the total taxable value of land and additions on the property. | Land | Improvement |
|---|---|---|---|---|
| 2025 | $6,285 | $540,900 | $325,500 | $215,400 |
| 2024 | $6,147 | $521,400 | $325,500 | $195,900 |
| 2023 | $6,020 | $478,500 | $282,600 | $195,900 |
| 2022 | $5,428 | $386,300 | $214,100 | $172,200 |
| 2021 | $5,419 | $369,900 | $237,900 | $132,000 |
| 2020 | $5,042 | $347,500 | $222,200 | $125,300 |
| 2019 | $4,979 | $339,600 | $214,300 | $125,300 |
| 2018 | $4,723 | $322,400 | $210,400 | $112,000 |
| 2017 | $4,499 | $308,600 | $196,600 | $112,000 |
| 2016 | $4,275 | $294,800 | $199,400 | $95,400 |
| 2015 | $4,299 | $289,700 | $194,300 | $95,400 |
| 2014 | $3,842 | $265,900 | $170,500 | $95,400 |
Source: Public Records
Map
Nearby Homes
- 60 Pine St
- 18 Mary Anne Dr
- 20 Hawthorne Village Unit A
- 4 Linda Ln
- 8 Apache Rd
- 44 Arapahoe Rd
- 56 Puddingstone Ln
- 462 Hartford Ave
- 1391 Pond St
- 17 Pine St
- 21 Maple St
- 10 Franklin St
- 29 Hancock Rd
- 8 Woodhaven Dr
- 34 Schofield Dr
- 48 Dover Cir
- 27 Dover Cir
- 6 Freedom Trail
- 253 Village St
- 2 Kingson Ln Unit 2
Your Personal Tour Guide
Ask me questions while you tour the home.