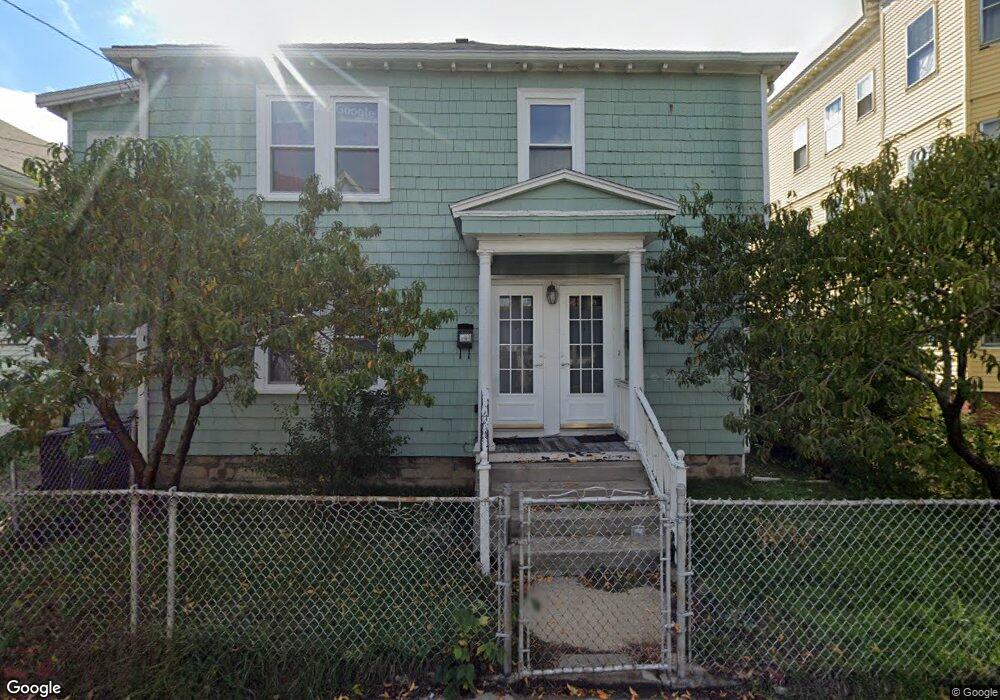
50 Royal St Unit 52 Allston, MA 02134
Allston NeighborhoodEstimated Value: $1,220,000 - $1,570,055
4
Beds
2
Baths
2,778
Sq Ft
$492/Sq Ft
Est. Value
About This Home
This home is located at 50 Royal St Unit 52, Allston, MA 02134 and is currently estimated at $1,367,514, approximately $492 per square foot. 50 Royal St Unit 52 is a home located in Suffolk County with nearby schools including Match Charter Public School, Boston Green Academy Horace Mann Charter School, and German International School Boston.
Ownership History
Date
Name
Owned For
Owner Type
Purchase Details
Closed on
Sep 22, 2010
Sold by
Lim Ft
Bought by
Zedek Thalia M
Current Estimated Value
Home Financials for this Owner
Home Financials are based on the most recent Mortgage that was taken out on this home.
Original Mortgage
$400,000
Outstanding Balance
$264,668
Interest Rate
4.48%
Mortgage Type
Purchase Money Mortgage
Estimated Equity
$1,102,846
Create a Home Valuation Report for This Property
The Home Valuation Report is an in-depth analysis detailing your home's value as well as a comparison with similar homes in the area
Home Values in the Area
Average Home Value in this Area
Purchase History
| Date | Buyer | Sale Price | Title Company |
|---|---|---|---|
| Zedek Thalia M | $457,000 | -- |
Source: Public Records
Mortgage History
| Date | Status | Borrower | Loan Amount |
|---|---|---|---|
| Open | Zedek Thalia M | $400,000 |
Source: Public Records
Tax History Compared to Growth
Tax History
| Year | Tax Paid | Tax Assessment Tax Assessment Total Assessment is a certain percentage of the fair market value that is determined by local assessors to be the total taxable value of land and additions on the property. | Land | Improvement |
|---|---|---|---|---|
| 2025 | $14,588 | $1,259,800 | $475,700 | $784,100 |
| 2024 | $12,948 | $1,187,900 | $282,000 | $905,900 |
| 2023 | $12,032 | $1,120,300 | $266,000 | $854,300 |
| 2022 | $11,499 | $1,056,900 | $250,900 | $806,000 |
| 2021 | $11,277 | $1,056,900 | $250,900 | $806,000 |
| 2020 | $8,903 | $843,100 | $233,200 | $609,900 |
| 2019 | $8,303 | $787,800 | $172,000 | $615,800 |
| 2018 | $7,643 | $729,300 | $172,000 | $557,300 |
| 2017 | $7,572 | $715,000 | $172,000 | $543,000 |
| 2016 | $6,839 | $621,700 | $172,000 | $449,700 |
| 2015 | $6,594 | $544,500 | $159,500 | $385,000 |
| 2014 | $5,954 | $473,300 | $159,500 | $313,800 |
Source: Public Records
Map
Nearby Homes
- 22 Royal St
- 27 Coolidge Rd Unit 1
- 11 Easton St
- 8 Franklin St Unit 202
- 8 Franklin St Unit 403
- 8 Franklin St Unit 401
- 1 Highgate St
- 4 Franklin St Unit 403
- 54-60 Holton St Unit 58
- 106 Chester St Unit 3
- 20 Penniman Rd Unit 208
- 30 Penniman Rd Unit 201
- 178 Brighton Ave Unit 12
- 59 Brighton Ave Unit 1
- 57 Brighton Ave Unit C
- 57 Brighton Ave Unit B
- 57 Brighton Ave Unit A
- 15 N Beacon St Unit 328
- 15 N Beacon St Unit 412
- 15 N Beacon St Unit L01
- 46 Royal St Unit 48
- 54 Royal St
- 35 Mansfield St Unit 1
- 35 Mansfield St Unit 37
- 37 Mansfield St Unit 1
- 31 Mansfield St Unit 33
- 31 Mansfield St Unit n/a
- 31 Mansfield St Unit 1-02
- 31 Mansfield St
- 39 Mansfield St
- 42 Royal St Unit 42A
- 58 Royal St
- 51 Royal St
- 51 Royal St Unit 2
- 53 Royal St
- 47 Royal St Unit 49
- 27 Mansfield St Unit 29
- 43 Royal St
- 60 Royal St
- 60 Royal St