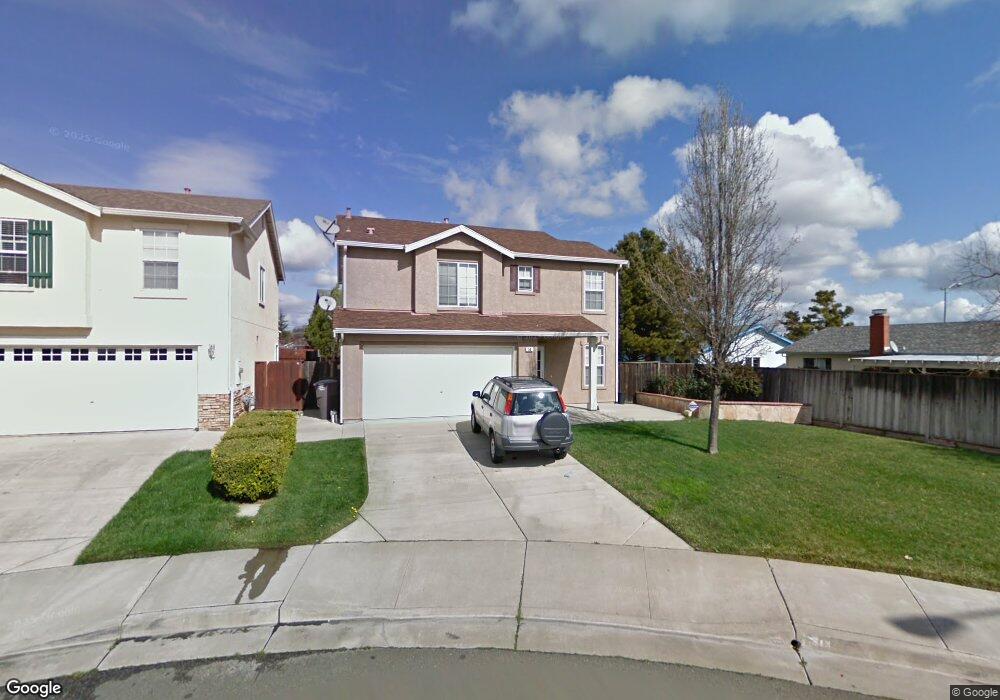
50 Tea Rose Ct Suisun City, CA 94585
Estimated Value: $537,571 - $586,000
4
Beds
2
Baths
1,766
Sq Ft
$313/Sq Ft
Est. Value
About This Home
This home is located at 50 Tea Rose Ct, Suisun City, CA 94585 and is currently estimated at $551,893, approximately $312 per square foot. 50 Tea Rose Ct is a home located in Solano County with nearby schools including Crescent Elementary School, Crystal Middle School, and Armijo High School.
Ownership History
Date
Name
Owned For
Owner Type
Purchase Details
Closed on
Sep 19, 2016
Sold by
Qis Llc
Bought by
Csh Property One Llc
Current Estimated Value
Purchase Details
Closed on
Apr 18, 2011
Sold by
Lo Victor
Bought by
Qis Llc
Purchase Details
Closed on
Aug 28, 2006
Sold by
Lo Victor and Chen Ying Hui
Bought by
Lo Victor
Home Financials for this Owner
Home Financials are based on the most recent Mortgage that was taken out on this home.
Original Mortgage
$210,000
Interest Rate
6.67%
Mortgage Type
New Conventional
Purchase Details
Closed on
May 12, 2006
Sold by
Chen Ying Hui
Bought by
Lo Victor and Chen Ying Hui
Purchase Details
Closed on
Aug 20, 1998
Sold by
Lo Victor
Bought by
Chen Ying Hui
Home Financials for this Owner
Home Financials are based on the most recent Mortgage that was taken out on this home.
Original Mortgage
$110,900
Interest Rate
6.88%
Create a Home Valuation Report for This Property
The Home Valuation Report is an in-depth analysis detailing your home's value as well as a comparison with similar homes in the area
Home Values in the Area
Average Home Value in this Area
Purchase History
| Date | Buyer | Sale Price | Title Company |
|---|---|---|---|
| Csh Property One Llc | $315,500 | Fidelity National Title Co | |
| Qis Llc | $139,300 | None Available | |
| Lo Victor | -- | Fidelity National Title Co | |
| Lo Victor | -- | None Available | |
| Chen Ying Hui | -- | First American Title Guarant | |
| Chen Ying Hui | $158,500 | First American Title Guarant |
Source: Public Records
Mortgage History
| Date | Status | Borrower | Loan Amount |
|---|---|---|---|
| Previous Owner | Lo Victor | $210,000 | |
| Previous Owner | Chen Ying Hui | $110,900 |
Source: Public Records
Tax History Compared to Growth
Tax History
| Year | Tax Paid | Tax Assessment Tax Assessment Total Assessment is a certain percentage of the fair market value that is determined by local assessors to be the total taxable value of land and additions on the property. | Land | Improvement |
|---|---|---|---|---|
| 2025 | $4,826 | $414,322 | $98,647 | $315,675 |
| 2024 | $4,826 | $406,199 | $96,713 | $309,486 |
| 2023 | $4,683 | $398,235 | $94,817 | $303,418 |
| 2022 | $4,679 | $390,427 | $92,958 | $297,469 |
| 2021 | $4,636 | $382,773 | $91,136 | $291,637 |
| 2020 | $4,747 | $378,849 | $90,202 | $288,647 |
| 2019 | $4,640 | $371,422 | $88,434 | $282,988 |
| 2018 | $4,819 | $364,140 | $86,700 | $277,440 |
| 2017 | $4,769 | $357,000 | $85,000 | $272,000 |
| 2016 | $2,725 | $178,572 | $43,290 | $135,282 |
| 2015 | $2,584 | $175,890 | $42,640 | $133,250 |
| 2014 | $2,572 | $172,445 | $41,805 | $130,640 |
Source: Public Records
Map
Nearby Homes
- 114 Birchwood Ct
- 116 Birchwood Ct
- 56 Terry Ln
- 230 Empire Place
- 906 Taft St
- 519 Rio Verde
- 249 E Tennessee St
- 85 Coral Ln
- 79 Chipman Ln
- 518 Carolina St
- 1207 E Tennessee St
- 224 E Colorado St
- 145 Summertime Ln
- 915 Liberty Dr
- 141 Summertime Ln
- 8 Deck Dr
- 518 Empire St
- 1105 Strawberry Ln
- 1113 Strawberry Ln
- 1125 Strawberry Ln