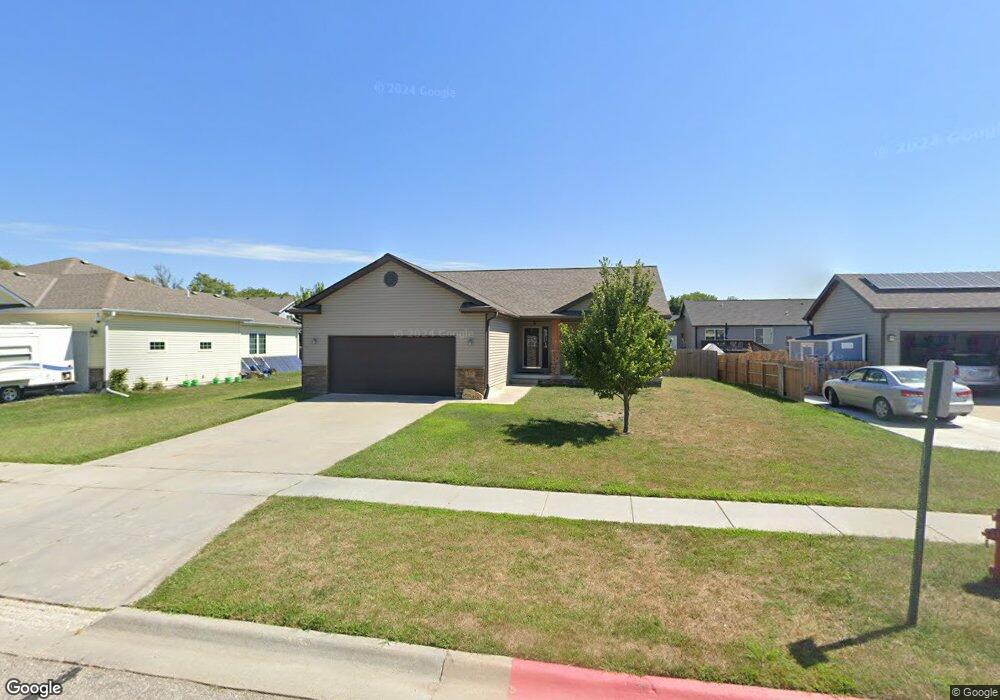
50 Vince Dr Bennet, NE 68317
Estimated Value: $315,939 - $395,000
3
Beds
2
Baths
1,310
Sq Ft
$268/Sq Ft
Est. Value
About This Home
This home is located at 50 Vince Dr, Bennet, NE 68317 and is currently estimated at $351,735, approximately $268 per square foot. 50 Vince Dr is a home located in Lancaster County with nearby schools including Elementary at Bennet and Junior/Senior High School at Palmyra.
Ownership History
Date
Name
Owned For
Owner Type
Purchase Details
Closed on
Sep 9, 2011
Sold by
Aspen Builders Inc
Bought by
Spurlock Joshua A and Spurlock Laura E
Current Estimated Value
Home Financials for this Owner
Home Financials are based on the most recent Mortgage that was taken out on this home.
Original Mortgage
$169,637
Outstanding Balance
$117,509
Interest Rate
4.58%
Mortgage Type
New Conventional
Estimated Equity
$234,226
Purchase Details
Closed on
Apr 14, 2011
Sold by
Bennet Ridge L L C
Bought by
Aspen Builders Inc
Create a Home Valuation Report for This Property
The Home Valuation Report is an in-depth analysis detailing your home's value as well as a comparison with similar homes in the area
Home Values in the Area
Average Home Value in this Area
Purchase History
| Date | Buyer | Sale Price | Title Company |
|---|---|---|---|
| Spurlock Joshua A | $164,000 | Union Title Company Llc | |
| Aspen Builders Inc | $25,000 | Utc |
Source: Public Records
Mortgage History
| Date | Status | Borrower | Loan Amount |
|---|---|---|---|
| Open | Spurlock Joshua A | $169,637 |
Source: Public Records
Tax History Compared to Growth
Tax History
| Year | Tax Paid | Tax Assessment Tax Assessment Total Assessment is a certain percentage of the fair market value that is determined by local assessors to be the total taxable value of land and additions on the property. | Land | Improvement |
|---|---|---|---|---|
| 2025 | $3,498 | $286,000 | $70,000 | $216,000 |
| 2024 | $3,498 | $271,600 | $62,000 | $209,600 |
| 2023 | $4,745 | $271,600 | $62,000 | $209,600 |
| 2022 | $4,172 | $220,700 | $48,000 | $172,700 |
| 2021 | $3,935 | $220,700 | $48,000 | $172,700 |
| 2020 | $3,845 | $207,800 | $48,000 | $159,800 |
| 2019 | $3,867 | $207,800 | $48,000 | $159,800 |
| 2018 | $3,517 | $181,700 | $35,000 | $146,700 |
| 2017 | $3,403 | $181,700 | $35,000 | $146,700 |
| 2016 | $3,312 | $162,000 | $30,000 | $132,000 |
| 2015 | $3,244 | $162,000 | $30,000 | $132,000 |
| 2014 | -- | $158,000 | $30,000 | $128,000 |
| 2013 | -- | $158,000 | $30,000 | $128,000 |
Source: Public Records
Map
Nearby Homes
- 135 Jefferson St
- Acreage 1 134th & Satillo Rd
- 195 Switchgrass Ln
- 185 Switchgrass Ln
- 0000 Jackson St
- 380 Van Buren St
- 1240 Hackberry St
- 13611 S 150th Ct
- 1220 Evergreen Rd
- 920 Evergreen Rd
- 985 Evergreen Rd
- 400 Evergreen Rd
- 415 Evergreen Rd
- 1223 Evergreen Rd
- 1020 Evergreen Rd
- 1000 Evergreen Rd
- 1140 Evergreen Rd
- 1125 Evergreen Rd
- 420 Evergreen Rd
- 1180 Evergreen Rd