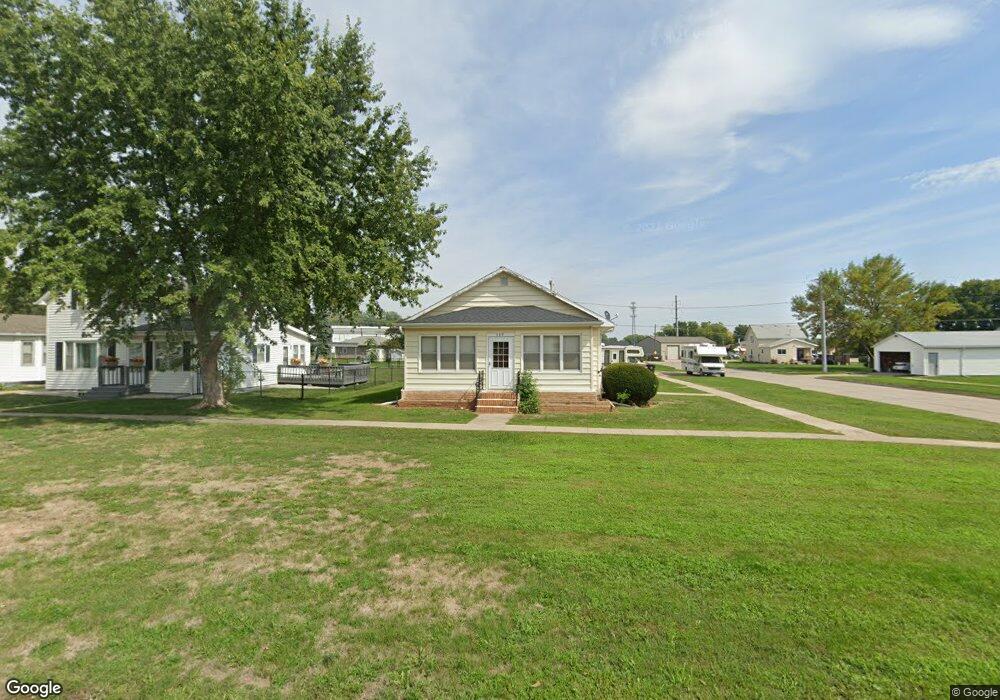
500 D St Sergeant Bluff, IA 51054
Estimated Value: $172,532 - $201,000
3
Beds
1
Bath
1,144
Sq Ft
$162/Sq Ft
Est. Value
About This Home
This home is located at 500 D St, Sergeant Bluff, IA 51054 and is currently estimated at $185,133, approximately $161 per square foot. 500 D St is a home located in Woodbury County with nearby schools including Sergeant Bluff-Luton Primary School, Sergeant Bluff-Luton Elementary School, and Sergeant Bluff-Luton Middle School.
Ownership History
Date
Name
Owned For
Owner Type
Purchase Details
Closed on
Nov 30, 2010
Sold by
Ingalls Loran H and Ingalls Betty L
Bought by
Pry Kelly L and Pry Jenice A
Current Estimated Value
Home Financials for this Owner
Home Financials are based on the most recent Mortgage that was taken out on this home.
Original Mortgage
$64,000
Interest Rate
4.19%
Mortgage Type
Future Advance Clause Open End Mortgage
Create a Home Valuation Report for This Property
The Home Valuation Report is an in-depth analysis detailing your home's value as well as a comparison with similar homes in the area
Home Values in the Area
Average Home Value in this Area
Purchase History
| Date | Buyer | Sale Price | Title Company |
|---|---|---|---|
| Pry Kelly L | $80,000 | None Available |
Source: Public Records
Mortgage History
| Date | Status | Borrower | Loan Amount |
|---|---|---|---|
| Closed | Pry Kelly L | $64,000 |
Source: Public Records
Tax History
| Year | Tax Paid | Tax Assessment Tax Assessment Total Assessment is a certain percentage of the fair market value that is determined by local assessors to be the total taxable value of land and additions on the property. | Land | Improvement |
|---|---|---|---|---|
| 2025 | $2,014 | $140,350 | $11,760 | $128,590 |
| 2024 | $20 | $130,580 | $10,500 | $120,080 |
| 2023 | $1,908 | $130,580 | $10,500 | $120,080 |
| 2022 | $1,892 | $108,590 | $10,500 | $98,090 |
| 2021 | $1,892 | $108,590 | $10,500 | $98,090 |
| 2020 | $1,656 | $93,230 | $11,240 | $81,990 |
| 2019 | $1,580 | $93,230 | $11,240 | $81,990 |
| 2018 | $1,542 | $87,770 | $11,240 | $76,530 |
| 2017 | $1,602 | $87,770 | $11,240 | $76,530 |
| 2016 | $1,634 | $84,120 | $0 | $0 |
| 2015 | $1,571 | $78,610 | $10,500 | $68,110 |
| 2014 | $1,482 | $78,610 | $10,500 | $68,110 |
Source: Public Records
Map
Nearby Homes
Your Personal Tour Guide
Ask me questions while you tour the home.