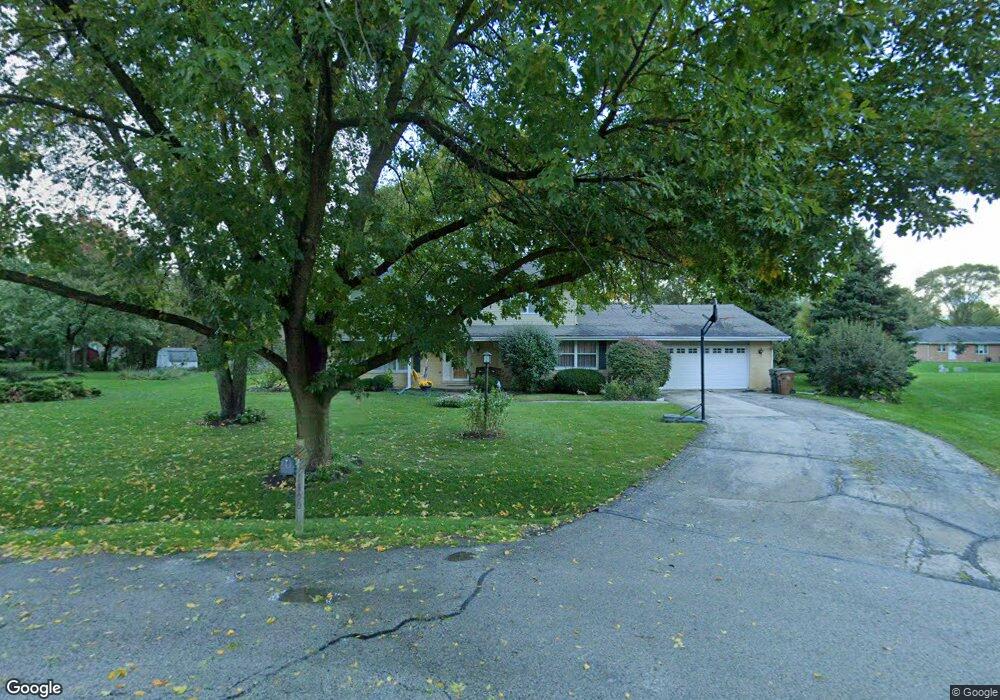
500 Frankie Ct Prospect Heights, IL 60070
Estimated Value: $675,586 - $746,000
4
Beds
4
Baths
2,952
Sq Ft
$240/Sq Ft
Est. Value
About This Home
This home is located at 500 Frankie Ct, Prospect Heights, IL 60070 and is currently estimated at $708,147, approximately $239 per square foot. 500 Frankie Ct is a home located in Cook County with nearby schools including Dwight D Eisenhower Elementary School, Anne Sullivan Elementary School, and Betsy Ross Elementary School.
Ownership History
Date
Name
Owned For
Owner Type
Purchase Details
Closed on
Oct 24, 2012
Sold by
Lundgren Kurt Dennis
Bought by
Lundgren Kurt Dennis and Lundgren Kristina Maria
Current Estimated Value
Home Financials for this Owner
Home Financials are based on the most recent Mortgage that was taken out on this home.
Original Mortgage
$152,400
Outstanding Balance
$103,348
Interest Rate
3%
Mortgage Type
Adjustable Rate Mortgage/ARM
Estimated Equity
$604,799
Purchase Details
Closed on
Jan 30, 1995
Sold by
Lundgren Mary Irene
Bought by
Lundgren Kurt Dennis
Create a Home Valuation Report for This Property
The Home Valuation Report is an in-depth analysis detailing your home's value as well as a comparison with similar homes in the area
Home Values in the Area
Average Home Value in this Area
Purchase History
| Date | Buyer | Sale Price | Title Company |
|---|---|---|---|
| Lundgren Kurt Dennis | -- | None Available | |
| Lundgren Kurt Dennis | -- | -- |
Source: Public Records
Mortgage History
| Date | Status | Borrower | Loan Amount |
|---|---|---|---|
| Open | Lundgren Kurt Dennis | $152,400 |
Source: Public Records
Tax History Compared to Growth
Tax History
| Year | Tax Paid | Tax Assessment Tax Assessment Total Assessment is a certain percentage of the fair market value that is determined by local assessors to be the total taxable value of land and additions on the property. | Land | Improvement |
|---|---|---|---|---|
| 2024 | $12,683 | $45,518 | $6,078 | $39,440 |
| 2023 | $11,862 | $45,518 | $6,078 | $39,440 |
| 2022 | $11,862 | $45,518 | $6,078 | $39,440 |
| 2021 | $10,815 | $36,313 | $5,317 | $30,996 |
| 2020 | $10,977 | $37,671 | $5,317 | $32,354 |
| 2019 | $11,791 | $45,029 | $5,317 | $39,712 |
| 2018 | $11,800 | $41,606 | $4,558 | $37,048 |
| 2017 | $11,686 | $41,606 | $4,558 | $37,048 |
| 2016 | $11,127 | $41,606 | $4,558 | $37,048 |
| 2015 | $12,126 | $41,218 | $3,798 | $37,420 |
| 2014 | $12,015 | $41,218 | $3,798 | $37,420 |
| 2013 | $11,702 | $41,218 | $3,798 | $37,420 |
Source: Public Records
Map
Nearby Homes
- 412 W Olive Ave
- 2611 E Radford Ct
- 2315 E Olive St Unit 3G
- 2315 E Olive St Unit 2G
- 2424 E Oakton St Unit 3C
- 2420 E Brandenberry Ct Unit 4C
- 1215 N Waterman Ave Unit 3L
- 2403 E Brandenberry Ct Unit 2A
- 2431 E Brandenberry Ct Unit 2O
- 2443 E Brandenberry Ct Unit 2A
- 2443 E Brandenberry Ct Unit 1B
- 910 Persimmon Ln Unit A
- 1401 Plum Ct Unit D
- 1311 Nutmeg Ct Unit A
- 1101 N Stratford Rd
- 1510 N Kendal Ct Unit 11510
- 802 Butternut Ln Unit C
- 802 Butternut Ln Unit D
- 1912 N Coldspring Rd Unit 96
- 1511 N Windsor Dr Unit 208