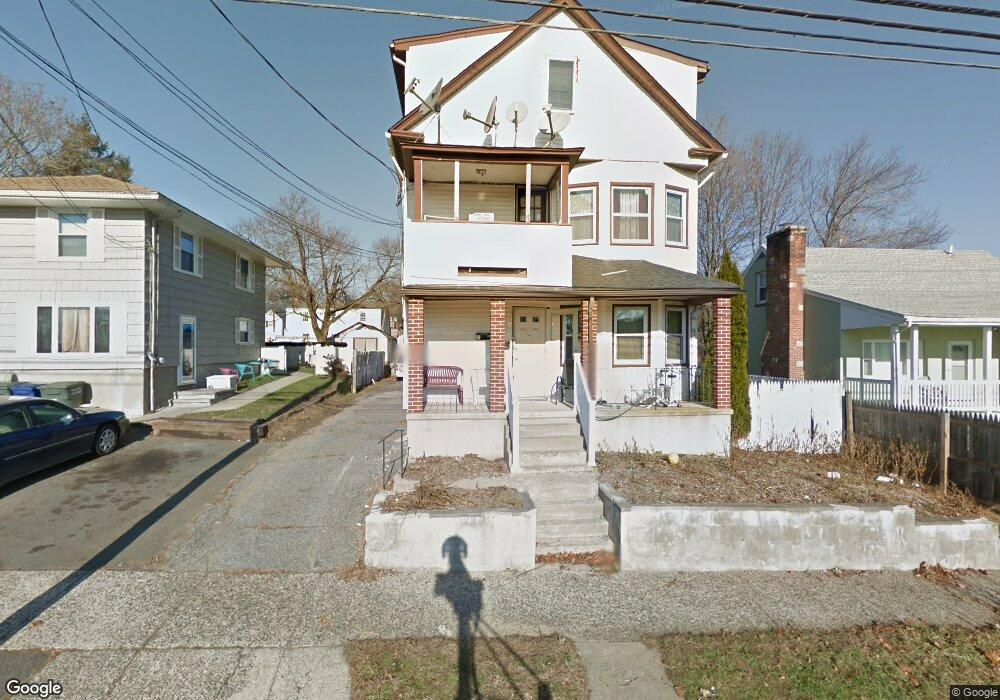
500 Thorme St Bridgeport, CT 06606
North End NeighborhoodEstimated Value: $466,000 - $672,000
6
Beds
3
Baths
2,800
Sq Ft
$205/Sq Ft
Est. Value
About This Home
This home is located at 500 Thorme St, Bridgeport, CT 06606 and is currently estimated at $573,828, approximately $204 per square foot. 500 Thorme St is a home located in Fairfield County with nearby schools including Blackham School, Central High School, and Assumption Catholic School.
Ownership History
Date
Name
Owned For
Owner Type
Purchase Details
Closed on
Jun 9, 2023
Sold by
Bridgeport City Of
Bought by
Pinto Paulo and Pinto Katie A
Current Estimated Value
Purchase Details
Closed on
Nov 19, 2004
Sold by
Cruz Jose and Cruz Maria
Bought by
Pinto Paulo
Home Financials for this Owner
Home Financials are based on the most recent Mortgage that was taken out on this home.
Original Mortgage
$264,000
Interest Rate
5.8%
Mortgage Type
Purchase Money Mortgage
Purchase Details
Closed on
Oct 16, 1998
Sold by
Tuozzoli Theresa V
Bought by
Cruz Jose and Cruz Maria
Home Financials for this Owner
Home Financials are based on the most recent Mortgage that was taken out on this home.
Original Mortgage
$96,800
Interest Rate
6.8%
Mortgage Type
Purchase Money Mortgage
Create a Home Valuation Report for This Property
The Home Valuation Report is an in-depth analysis detailing your home's value as well as a comparison with similar homes in the area
Home Values in the Area
Average Home Value in this Area
Purchase History
| Date | Buyer | Sale Price | Title Company |
|---|---|---|---|
| Pinto Paulo | -- | None Available | |
| Pinto Paulo | -- | None Available | |
| Pinto Paulo | $330,000 | -- | |
| Pinto Paulo | $330,000 | -- | |
| Cruz Jose | $121,000 | -- | |
| Cruz Jose | $121,000 | -- |
Source: Public Records
Mortgage History
| Date | Status | Borrower | Loan Amount |
|---|---|---|---|
| Previous Owner | Cruz Jose | $264,000 | |
| Previous Owner | Cruz Jose | $96,800 |
Source: Public Records
Tax History
| Year | Tax Paid | Tax Assessment Tax Assessment Total Assessment is a certain percentage of the fair market value that is determined by local assessors to be the total taxable value of land and additions on the property. | Land | Improvement |
|---|---|---|---|---|
| 2025 | $8,319 | $191,470 | $75,310 | $116,160 |
| 2024 | $8,319 | $191,470 | $75,310 | $116,160 |
| 2023 | $8,319 | $191,470 | $75,310 | $116,160 |
| 2022 | $8,319 | $191,470 | $75,310 | $116,160 |
| 2021 | $8,319 | $191,470 | $75,310 | $116,160 |
| 2020 | $7,542 | $139,700 | $43,270 | $96,430 |
| 2019 | $7,542 | $139,700 | $43,270 | $96,430 |
| 2018 | $7,595 | $139,700 | $43,270 | $96,430 |
| 2017 | $7,595 | $139,700 | $43,270 | $96,430 |
| 2016 | $7,595 | $139,700 | $43,270 | $96,430 |
| 2015 | $7,766 | $184,040 | $49,980 | $134,060 |
| 2014 | $7,766 | $184,040 | $49,980 | $134,060 |
Source: Public Records
Map
Nearby Homes
- 574 Thorme St
- 604 Birmingham St
- 26 Marsdale Ave
- 120 Clark St
- 234 Savoy St
- 625 Clark St
- 375 Ruth St
- 405 Westfield Ave
- 525 Westfield Ave
- 339 Goldenrod Ave
- 3461 Main St
- 619 Queen St
- 316 Goldenrod Ave
- 671 Fairview Ave
- 631 Fairview Ave
- 95 Savoy St
- 1095 Wayne St
- 105 Tremont Ave Unit E
- 105 Tremont Ave Unit 2
- 720 Queen St
Your Personal Tour Guide
Ask me questions while you tour the home.