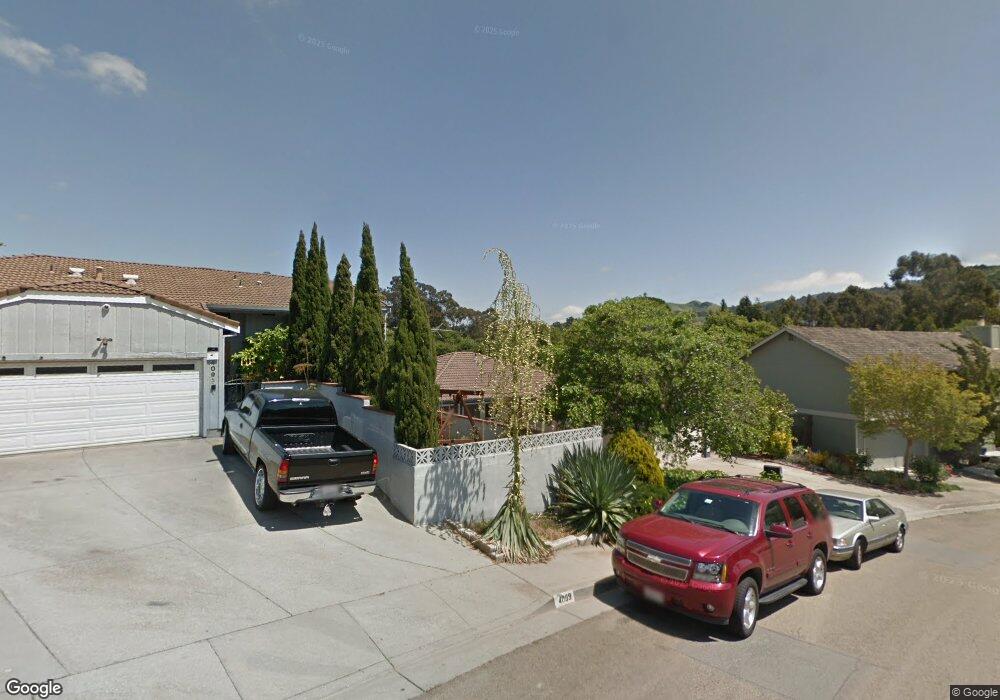
5001 Mozart Dr El Sobrante, CA 94803
Estimated Value: $704,297 - $830,000
3
Beds
2
Baths
1,449
Sq Ft
$519/Sq Ft
Est. Value
About This Home
This home is located at 5001 Mozart Dr, El Sobrante, CA 94803 and is currently estimated at $752,574, approximately $519 per square foot. 5001 Mozart Dr is a home located in Contra Costa County with nearby schools including Sheldon Elementary School, Betty Reid Soskin Middle School, and De Anza Senior High School.
Ownership History
Date
Name
Owned For
Owner Type
Purchase Details
Closed on
Nov 27, 2018
Sold by
Whalen David L and Whalen Susan C
Bought by
Neece Harry J and Campbell Amanda
Current Estimated Value
Home Financials for this Owner
Home Financials are based on the most recent Mortgage that was taken out on this home.
Original Mortgage
$444,000
Outstanding Balance
$391,173
Interest Rate
4.8%
Mortgage Type
New Conventional
Estimated Equity
$361,401
Purchase Details
Closed on
Feb 8, 2014
Sold by
Whalen David L and Whalen Susan C
Bought by
David L Whalen & Susan C Whalen Living T
Purchase Details
Closed on
Jun 15, 2010
Sold by
Whalen David L
Bought by
Whalen David L and Whalen Susan C
Home Financials for this Owner
Home Financials are based on the most recent Mortgage that was taken out on this home.
Original Mortgage
$168,750
Interest Rate
4.99%
Mortgage Type
New Conventional
Create a Home Valuation Report for This Property
The Home Valuation Report is an in-depth analysis detailing your home's value as well as a comparison with similar homes in the area
Home Values in the Area
Average Home Value in this Area
Purchase History
| Date | Buyer | Sale Price | Title Company |
|---|---|---|---|
| Neece Harry J | $555,000 | Old Republic Title Company | |
| David L Whalen & Susan C Whalen Living T | -- | None Available | |
| Whalen David L | -- | North American Title Company |
Source: Public Records
Mortgage History
| Date | Status | Borrower | Loan Amount |
|---|---|---|---|
| Open | Neece Harry J | $444,000 | |
| Previous Owner | Whalen David L | $168,750 |
Source: Public Records
Tax History Compared to Growth
Tax History
| Year | Tax Paid | Tax Assessment Tax Assessment Total Assessment is a certain percentage of the fair market value that is determined by local assessors to be the total taxable value of land and additions on the property. | Land | Improvement |
|---|---|---|---|---|
| 2025 | $9,705 | $619,108 | $396,007 | $223,101 |
| 2024 | $9,500 | $606,970 | $388,243 | $218,727 |
| 2023 | $9,500 | $595,070 | $380,631 | $214,439 |
| 2022 | $9,366 | $583,403 | $373,168 | $210,235 |
| 2021 | $9,319 | $571,964 | $365,851 | $206,113 |
| 2019 | $8,908 | $555,000 | $355,000 | $200,000 |
| 2018 | $3,831 | $204,160 | $77,200 | $126,960 |
| 2017 | $3,723 | $200,158 | $75,687 | $124,471 |
| 2016 | $3,648 | $196,234 | $74,203 | $122,031 |
| 2015 | $3,610 | $193,287 | $73,089 | $120,198 |
| 2014 | $3,579 | $189,502 | $71,658 | $117,844 |
Source: Public Records
Map
Nearby Homes
- 4047 Mozart Dr
- 4091 Garden Rd
- 3760 Via Verdi
- 3764 Via Verdi Unit 13
- 4022 San Pablo Dam Rd
- 0 Montera Ct
- 3706 Montera Ct
- 3034 Parker Rd
- 3944 La Cima Rd
- 10 Dove Ln
- 742 Alhambra Rd
- 4556 Appian Way Unit 36
- 4556 Appian Way Unit 12
- 4370 Wesley Way
- 57 Parkview Terrace
- 3027 Colette Dr
- 3275 Annapolis Ave
- 476 Colina Way
- 4441 Jana Vista Rd
- 6324 Bonita Ct