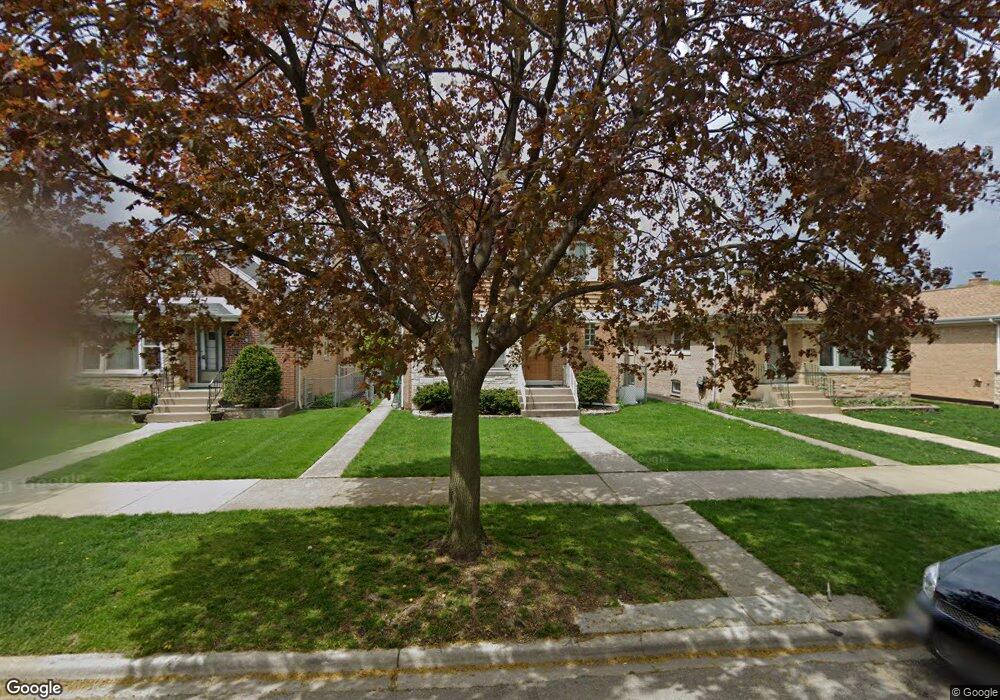
5008 N Natchez Ave Chicago, IL 60656
Norwood Park NeighborhoodEstimated Value: $505,000 - $653,000
4
Beds
3
Baths
1,800
Sq Ft
$314/Sq Ft
Est. Value
About This Home
This home is located at 5008 N Natchez Ave, Chicago, IL 60656 and is currently estimated at $565,674, approximately $314 per square foot. 5008 N Natchez Ave is a home located in Cook County with nearby schools including Garvy J Elementary School, William Howard Taft High School, and St. Monica Academy.
Ownership History
Date
Name
Owned For
Owner Type
Purchase Details
Closed on
Dec 28, 2012
Sold by
Kurian Easo Annamma Kurian and Kurian Easo
Bought by
Kurian Easo Valsa Kurian and Kurian Easo
Current Estimated Value
Purchase Details
Closed on
May 24, 2007
Sold by
Ruffolo Stacey and Ruffolo Luigi
Bought by
Kurian Easo Annamma Kurian and Kurian Easo
Home Financials for this Owner
Home Financials are based on the most recent Mortgage that was taken out on this home.
Original Mortgage
$352,000
Outstanding Balance
$214,461
Interest Rate
6.2%
Mortgage Type
Unknown
Estimated Equity
$351,213
Purchase Details
Closed on
Jul 31, 2001
Sold by
Lorch Ivy
Bought by
Mcnulty Stacey and Ruffolo Luigi
Home Financials for this Owner
Home Financials are based on the most recent Mortgage that was taken out on this home.
Original Mortgage
$211,200
Interest Rate
7.03%
Create a Home Valuation Report for This Property
The Home Valuation Report is an in-depth analysis detailing your home's value as well as a comparison with similar homes in the area
Home Values in the Area
Average Home Value in this Area
Purchase History
| Date | Buyer | Sale Price | Title Company |
|---|---|---|---|
| Kurian Easo Valsa Kurian | -- | Ravenswood Title Company Llc | |
| Kurian Easo Annamma Kurian | $440,000 | First American Title | |
| Mcnulty Stacey | $264,000 | First American Title |
Source: Public Records
Mortgage History
| Date | Status | Borrower | Loan Amount |
|---|---|---|---|
| Open | Kurian Easo Annamma Kurian | $352,000 | |
| Previous Owner | Mcnulty Stacey | $211,200 |
Source: Public Records
Tax History Compared to Growth
Tax History
| Year | Tax Paid | Tax Assessment Tax Assessment Total Assessment is a certain percentage of the fair market value that is determined by local assessors to be the total taxable value of land and additions on the property. | Land | Improvement |
|---|---|---|---|---|
| 2024 | $8,168 | $51,000 | $11,470 | $39,530 |
| 2023 | $7,940 | $42,000 | $9,176 | $32,824 |
| 2022 | $7,940 | $42,000 | $9,176 | $32,824 |
| 2021 | $7,782 | $42,004 | $9,180 | $32,824 |
| 2020 | $6,294 | $31,340 | $5,735 | $25,605 |
| 2019 | $6,311 | $34,823 | $5,735 | $29,088 |
| 2018 | $6,204 | $34,823 | $5,735 | $29,088 |
| 2017 | $5,115 | $27,121 | $5,046 | $22,075 |
| 2016 | $5,119 | $28,041 | $5,046 | $22,995 |
| 2015 | $5,460 | $32,400 | $5,046 | $27,354 |
| 2014 | $4,569 | $27,178 | $4,588 | $22,590 |
| 2013 | $4,468 | $27,178 | $4,588 | $22,590 |
Source: Public Records
Map
Nearby Homes
- 5000 N Mobile Ave
- 4824 N Natchez Ave
- 6420 W Gunnison St
- 5044 N Merrimac Ave
- 4959 N Merrimac Ave
- 6520 W Gunnison St
- 6316 W Lawrence Ave
- 4841 N Rutherford Ave
- 6352 W Giddings St
- 6509 W Higgins Ave
- 6140 W Gunnison St Unit 3
- 6228 W Lawrence Ave
- 5245 N Rutherford Ave
- 4828 N Newcastle Ave
- 5334 N Melvina Ave
- 4886 N Austin Ave
- 6137 W Giddings St
- 4544 N Mulligan Ave
- 6046 W Giddings St
- 5133 N Austin Ave
- 5004 N Natchez Ave
- 5012 N Natchez Ave
- 5016 N Natchez Ave
- 5000 N Natchez Ave
- 5020 N Natchez Ave
- 5009 N Neenah Ave
- 5011 N Neenah Ave
- 5005 N Neenah Ave
- 5024 N Natchez Ave
- 5017 N Neenah Ave
- 5001 N Neenah Ave
- 5021 N Neenah Ave
- 4956 N Natchez Ave
- 5028 N Natchez Ave
- 5009 N Natchez Ave
- 5005 N Natchez Ave
- 5011 N Natchez Ave
- 5025 N Neenah Ave
- 5001 N Natchez Ave
- 5017 N Natchez Ave